Forklift Accident Statistics: 84 U.S. Deaths in 2024, Injuries and Where the Numbers Come From
By Uptime Dock & Door Research · Updated September 2026
84 U.S. work deaths in 2024 had a forklift, order picker or powered platform truck as the primary source; BLS also estimates 25,110 private-industry DART cases in 2023–2024. The “85 deaths and 34,900 serious injuries a year” figure traces back to a 1995 OSHA proposal, according to Uptime Dock & Door Research’s September 2026 source review.
Below: the full forklift accident statistics, year by year, what these injuries actually do to people, and where the famous old numbers came from — including one OSHA itself put at about 8%, not 11%. DART means days away from work, restricted work or a job transfer. The short name “forklift category” below includes order pickers and powered platform trucks.
Key forklift accident statistics
- 84 workers died in the United States in 2024 with a forklift, order picker or powered platform truck as the primary source of the fatal injury. (U.S. Bureau of Labor Statistics, Census of Fatal Occupational Injuries (CFOI))
- 25,110 estimated U.S. private-industry injury and illness cases involved days away, restricted work or a job transfer in 2023 and 2024 combined, with a forklift, order picker or powered platform truck as the source. That averages 12,555 a year, not a measured count for either year. (Uptime Dock & Door Research calculation from BLS)
- The widely repeated “85 deaths and 34,900 serious injuries a year” traces back to an OSHA proposed rule published March 14, 1995. (Uptime Dock & Door Research review of 60 FR 13782)
- 46.9% of estimated U.S. private-industry forklift-category DART cases in 2023–2024 involved the legs or feet, compared with 23.7% of all-source DART cases, about twice the share. The category includes forklifts, order pickers and powered platform trucks; the all-source group includes those cases. (Uptime Dock & Door Research analysis of BLS forklift-category and all-source estimates)
- 18 calendar days was the median time away for U.S. private-industry days-away cases involving forklifts, order pickers and powered platform trucks in 2023–2024. The median for all-source days-away cases was 8 days. (BLS forklift-category and all-source medians)
- 1,002 workers died in U.S. work injuries with forklifts, order pickers or powered platform trucks as the primary source from 2011 through 2024, an average of about 72 a year. This sum spans a classification break in 2023. (Uptime Dock & Door Research sum of BLS 2011–2020, 2021–2022 and 2023–2024 counts)
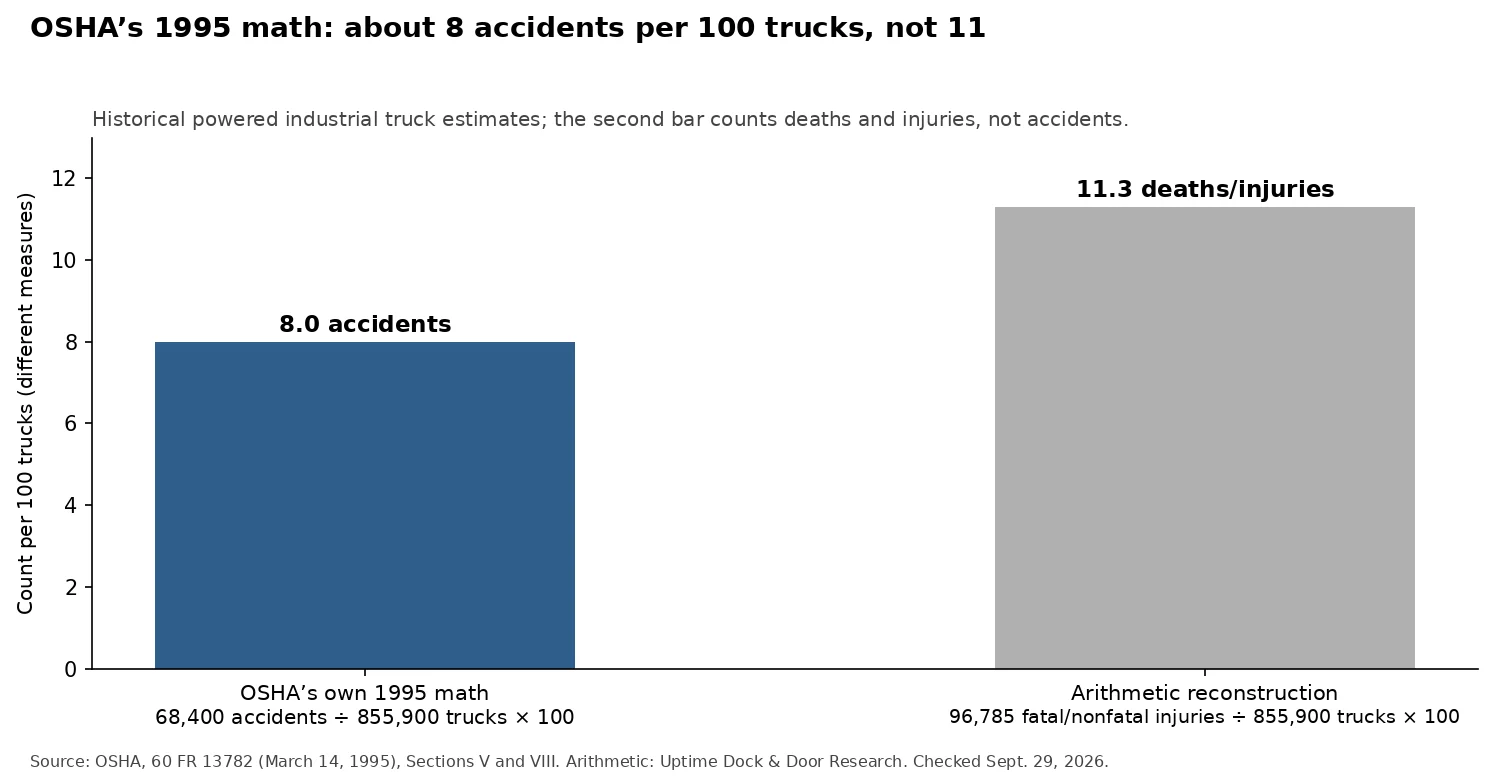
- In its 1995 proposal, OSHA estimated about 8% of U.S. powered industrial trucks had an accident each year, assuming no truck had more than one that year. That is a historical estimate, not a current “11%” risk figure. (Uptime Dock & Door Research review of 60 FR 13782, Section V)
- From 2011 through 2018, 77 of 551 U.S. primary-source deaths (14.0%) in the forklift, order-picker and powered-platform-truck category were coded as nonroadway jackknife or overturn events. The popular “42% are tip-overs” comes from 53 OSHA fatality case files from 1980–1986, a different population. (Uptime Dock & Door Research analysis of BLS and OSHA Table 5)
- Construction accounted for 23 of 84 U.S. primary-source deaths (27.4%) in the forklift, order-picker and powered-platform-truck category in 2024, up from 13 of 67 in 2023. (Uptime Dock & Door Research calculation from BLS construction and total counts)
- 15,460 estimated U.S. private-industry cases involving forklifts, order pickers or powered platform trucks included at least one day away after the day of injury or illness in 2023–2024. (BLS)
- For U.S. forklift-related work deaths in 2011–2017, BLS’s broader primary-or-secondary-source definition gives 614 deaths, compared with 466 using the primary-source definition, about 32% more. (Uptime Dock & Door Research comparison of the BLS factsheet and primary-source series)
- OSHA’s Powered Industrial Trucks standard (29 CFR 1910.178) ranked 8th among its most-cited standards in federal OSHA inspections across all industries for fiscal year 2025. (OSHA)
On this page: Deaths per year · Injuries per year · What the injuries look like · Which number to use · Where "85 deaths" came from · The 8% vs 11% math · How deaths happen · Who dies · Two BLS death counts · The "70%" training claim · Every famous number, traced · Up or down? · OSHA citations · At the loading dock · How we built this · Cite · Download · FAQ · Sources
How many people die in forklift accidents each year?
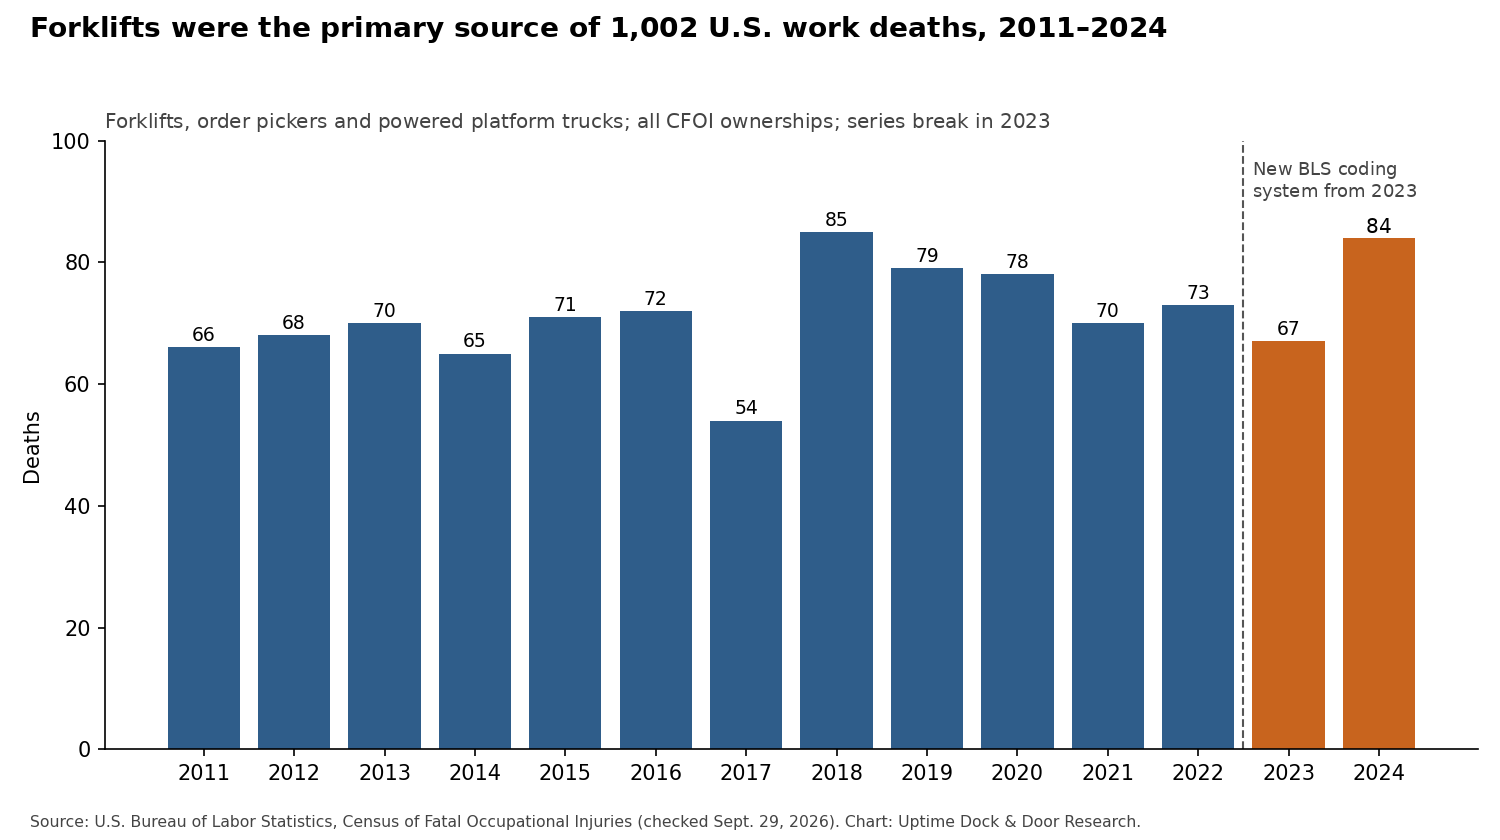
84 U.S. work deaths in 2024, the latest year returned by the checked BLS series, had a forklift, order picker or powered platform truck as the primary source. From 2011 through 2024, the count ran from 54 to 85 a year and totaled 1,002, or about 72 a year.
BLS publishes this one year at a time. Here is the whole run in one place.
Scroll horizontally to view all columns.
| Year | Deaths | BLS coding system |
|---|---|---|
| 2011 | 66 | OIICS 2.01 |
| 2012 | 68 | OIICS 2.01 |
| 2013 | 70 | OIICS 2.01 |
| 2014 | 65 | OIICS 2.01 |
| 2015 | 71 | OIICS 2.01 |
| 2016 | 72 | OIICS 2.01 |
| 2017 | 54 | OIICS 2.01 |
| 2018 | 85 | OIICS 2.01 |
| 2019 | 79 | OIICS 2.01 |
| 2020 | 78 | OIICS 2.01 |
| 2021 | 70 | OIICS 2.01 |
| 2022 | 73 | OIICS 2.01 |
| 2023 | 67 | OIICS 3.02 (new system) |
| 2024 | 84 | OIICS 3.03 (minor clarifications) |
| Total | 1,002 |
Source: BLS Census of Fatal Occupational Injuries, original 2011–2020, 2021–2022 and 2023–2024 series; forklifts, order pickers and powered platform trucks as the primary source; all CFOI ownerships, including self-employed workers. Total calculated by Uptime Dock & Door Research. OIICS versions: the major classification break is in 2023; the 2024 version adds minor clarifications. Do not read the full run as one uninterrupted comparable trend. Checked September 29, 2026.
Source: U.S. Bureau of Labor Statistics, Census of Fatal Occupational Injuries (checked Sept. 29, 2026). Chart: Uptime Dock & Door Research.
View supplied WebP chart image
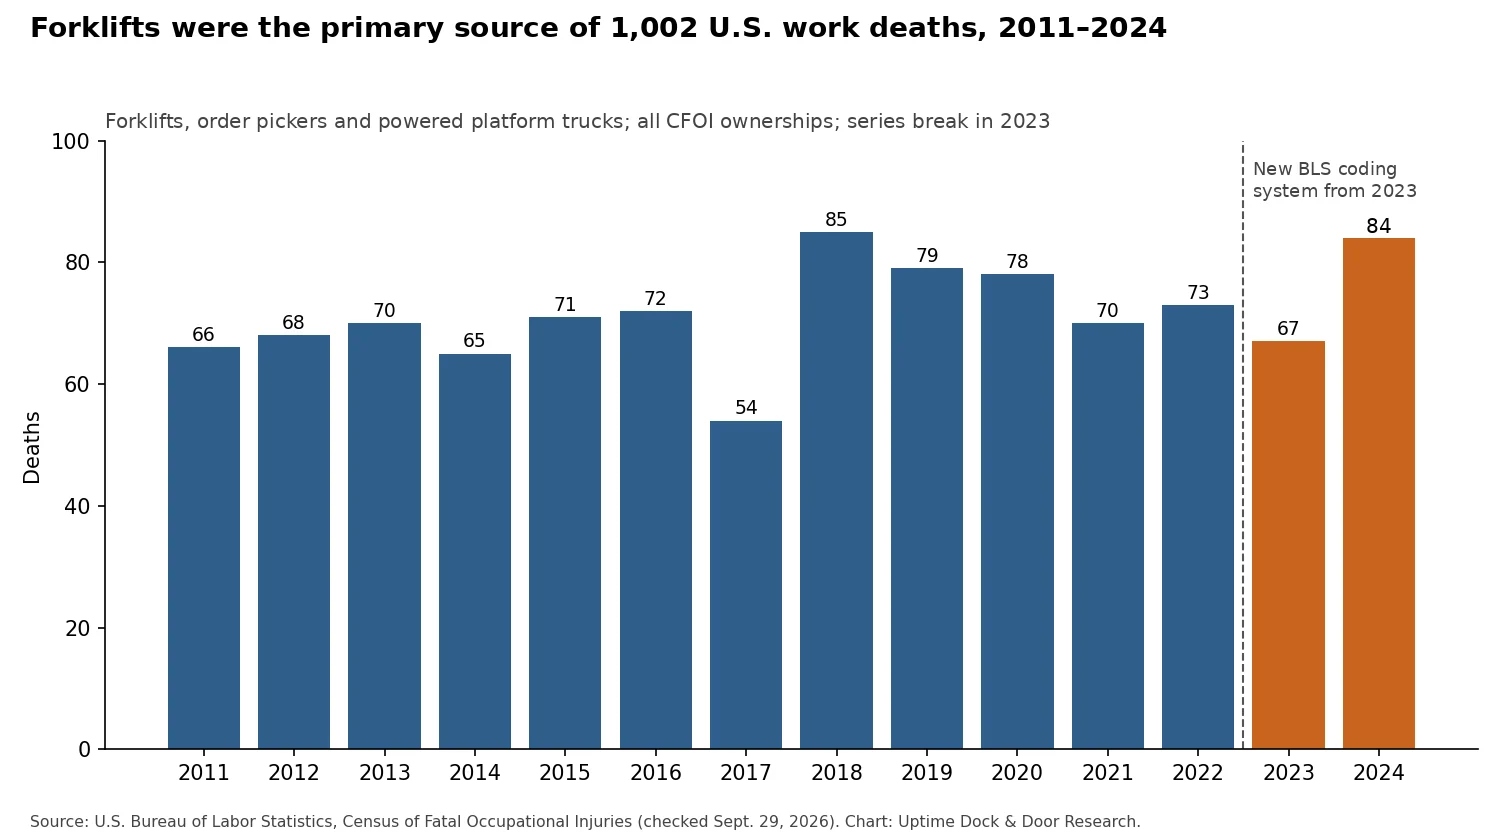
Put another way: 84 deaths in a year works out to one every 4.4 days on average (2024 was a leap year: 366 ÷ 84 = 4.4). That is a calendar average, not the measured time between incidents.
What counts as a "forklift" death here?
BLS counts a death here when a forklift, order picker or powered platform truck was the primary source. That is the object or substance that directly produced the injury, not a finding of fault. So the count includes order pickers and platform trucks, not just sit-down forklifts. CFOI covers work deaths across ownership types, including self-employed workers. (BLS source-role definitions)
How many forklift injuries happen each year?
BLS estimates 25,110 U.S. private-industry forklift-category cases with days away from work, restricted work or a job transfer in 2023 and 2024 combined. That is 12,555 a year on average. Of those, 15,460 involved at least one day away after the day of injury or illness. The category includes forklifts, order pickers and powered platform trucks.
Watch the dates here. BLS now publishes detailed injury counts every two years, not every year. So 25,110 is a two-year total, not one year's count. This BLS series does not split it into 2023 and 2024. Dividing by two gives a yearly average. It isn't a count for either year.
Three terms you'll see, in plain words:
- Days away (DAFW): the worker had at least one day away after the day the injury or illness began.
- Restricted or transferred (DJTR): the worker stayed on the job but couldn't do their normal work, or moved to a different job, with no days away.
- DART: both groups added together. It counts injury and illness cases that involve days away, restriction or transfer, not every recordable case or accident. These are work outcomes, not a medical severity rating.
Scroll horizontally to view all columns.
| Period | Days away (DAFW) | All DART cases | How BLS published it |
|---|---|---|---|
| 2011 | 6,130 | not published | one year |
| 2012 | 7,330 | not published | one year |
| 2013 | 6,820 | not published | one year |
| 2014 | 7,710 | not published | one year |
| 2015 | 6,820 | not published | one year |
| 2016 | 6,750 | not published | one year |
| 2017 | 7,490 | not published | one year |
| 2018 | 7,940 | not published | one year |
| 2019 | 8,140 | not published | one year |
| 2020 | 7,290 | not published | one year |
| 2021–2022 | 15,480 | 24,960 | two-year total |
| 2023–2024 | 15,460 | 25,110 | two-year total |
Source: BLS Survey of Occupational Injuries and Illnesses (SOII), original 2011–2020 days-away series, 2021–2022 DAFW and DART estimates, and 2023–2024 DAFW and DART estimates; U.S. private industry; the forklift, order-picker and powered-platform-truck source category. Counts are survey estimates. “Not published” refers to the listed detailed series, not zero cases. The CA codebook identifies the stored year as the biennium’s ending year, even when the API says “Annual.” The 2023 classification break also limits comparisons across periods. Checked September 29, 2026.
The published days-away estimates are similar in size. They averaged 7,242 a year from 2011 to 2020. The last two two-year totals, 15,480 and 15,460, work out to about 7,700 a year each. The reporting and coding changes mean this is not proof of an unchanged injury rate.
Do all 25,110 cases mean time off work?
No. About 4 in 10 did not involve a day away. In 2023–2024, an estimated 9,650 of the 25,110 U.S. private-industry forklift-category DART cases (38.4%) were restricted-duty or job-transfer cases only. BLS publishes 9,650 directly. Our subtraction also checks it: 25,110 − 15,460, since BLS defines DART as the two groups added together.
That 38.4% is not special to forklifts. For all-source private-industry injury and illness cases, the same share was 38.5%: (2,983,110 − 1,834,600) ÷ 2,983,110 × 100. That group includes forklift cases. Saying “25,110 cases required days away” would overstate the days-away estimate by 9,650 cases. These are cases, not a count of unique workers. (BLS DART and DAFW)
“No days away” does not mean “minor” or “no lost work time.” A worker might be on light duty for weeks or have a shortened workday. Those are examples, not details recorded for every case.
What do forklift injuries actually look like?
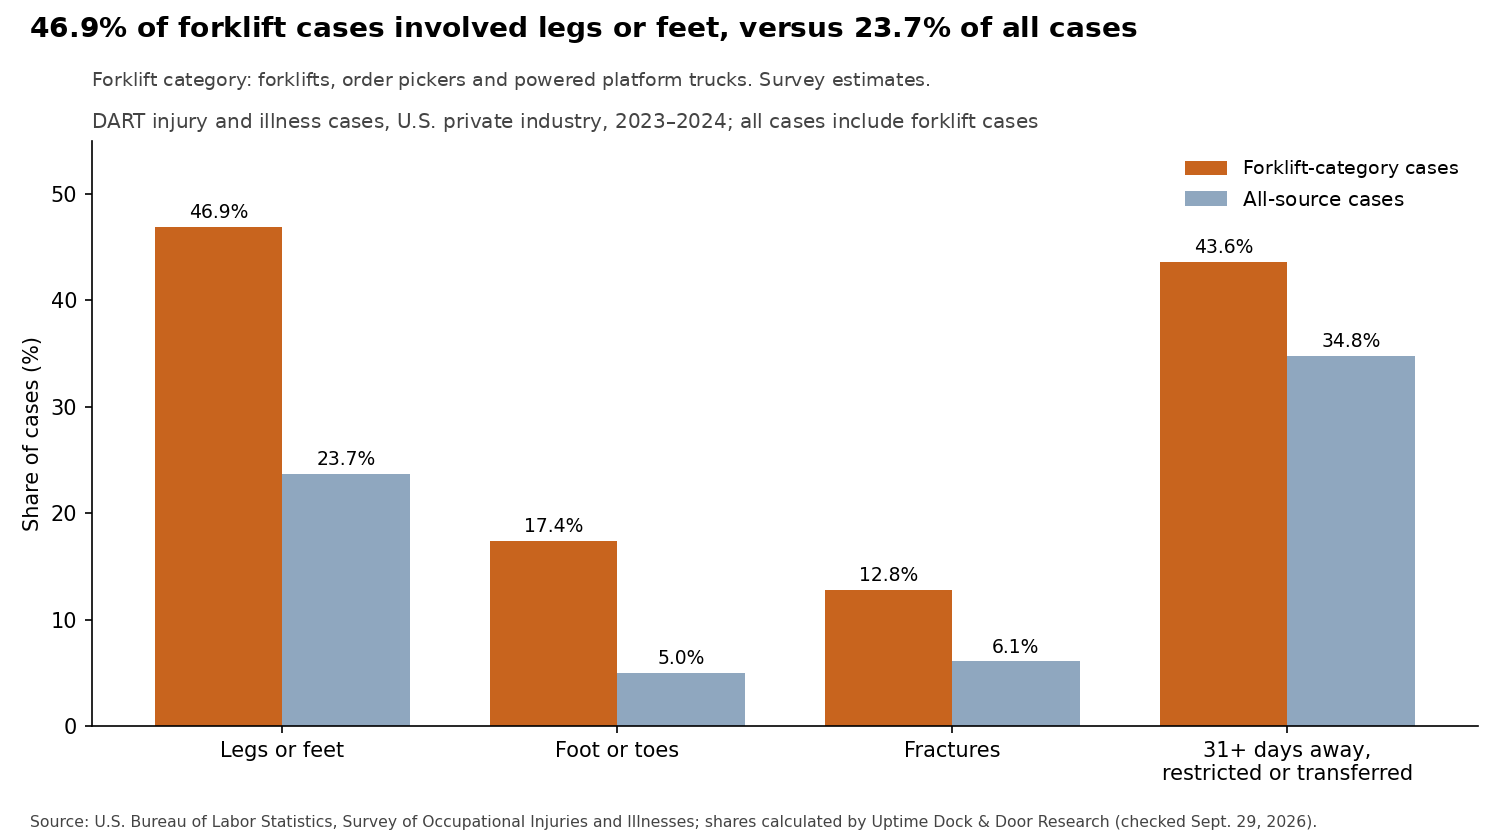
Nearly half of estimated U.S. private-industry forklift-category DART cases in 2023–2024 (46.9%) involved the legs or feet, about twice the share of all-source DART cases (23.7%). For cases with days away, the median time away was 18 calendar days, compared with 8 days across all sources.
This is where forklift injuries stand apart. We lined up BLS’s forklift category against all-source cases for the same two years, employer coverage and case type. The all-source group includes forklift cases; it is not a separate group of “other injuries.” Here is how the shares compare, not what a forklift caused to change.
Scroll horizontally to view all columns.
| What the case involved | Estimated forklift-category cases | Share of forklift-category cases | Share of all-source cases | Ratio of the two shares |
|---|---|---|---|---|
| Legs or feet (BLS "lower extremities") | 11,780 | 46.9% | 23.7% | 2.0× |
| Foot or toes | 4,380 | 17.4% | 5.0% | 3.5× |
| Broken bones (fractures) | 3,210 | 12.8% | 6.1% | 2.1× |
| 31 or more days away, restricted or transferred | 10,960 | 43.6% | 34.8% | 1.3× |
| Transportation incident (a vehicle in normal operation) | 11,180 | 44.5% | 4.1% | 11× |
| All cases | 25,110 | 100% | 100% (2,983,110 cases) |
Source: BLS Survey of Occupational Injuries and Illnesses, original 2023–2024 DART series for forklifts, order pickers and powered platform trucks and all sources; U.S. private industry. The CSV provides the exact numerator and denominator series for every row, including the lower-extremity numerator and all-source comparison. Shares and ratios calculated by Uptime Dock & Door Research from rounded survey estimates. Ratios use unrounded shares. Rows overlap: foot/toe cases are included in lower-extremity cases, and the other rows describe different traits of the same cases. Do not add them. Checked September 29, 2026.
Source: U.S. Bureau of Labor Statistics, Survey of Occupational Injuries and Illnesses; shares calculated by Uptime Dock & Door Research (checked Sept. 29, 2026).
View supplied WebP chart image
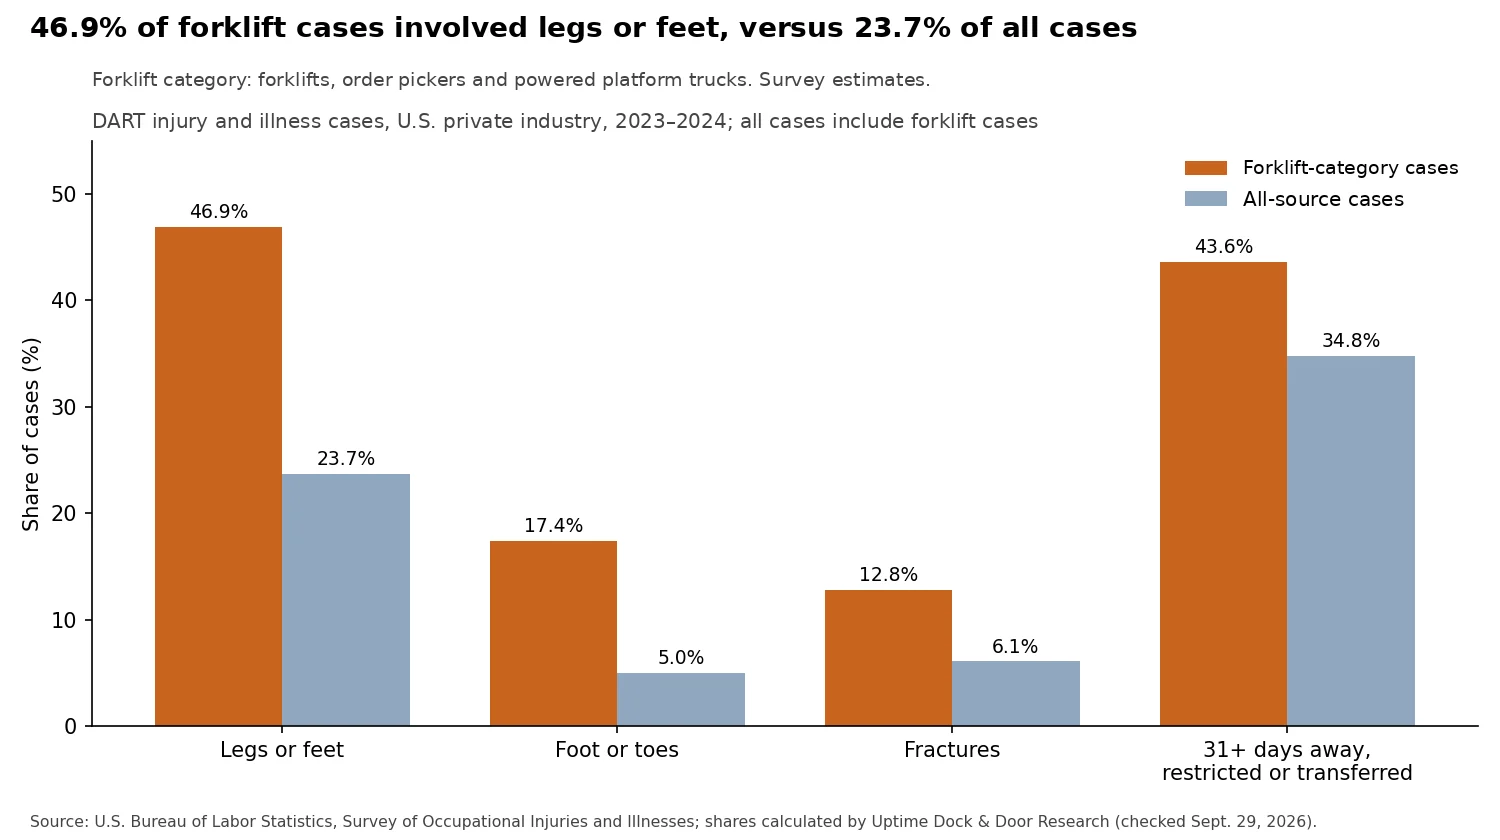
Picture a warehouse aisle. A worker’s foot could be in a truck’s path. That is an example of the hazard, not proof of what caused the cases in this table. Foot and toe injuries make up three and a half times the share in forklift-category cases compared with all-source cases.
The median time away is longer, too: 18 calendar days for forklift-category days-away cases, against 8 for all-source days-away cases. A median is the middle value; it does not mean exactly half lasted longer than that value. Counting days away, restriction or transfer together, the forklift-category median was 22 days against 14 for all sources. These medians are not averages and cannot be added or subtracted to find total lost days.
One more way to see the scale. Forklifts, order pickers and powered platform trucks were the source of fewer than 1 in 100 private-industry DART cases in 2023–2024 (0.84%: 25,110 ÷ 2,983,110 × 100). Their days-away cases had a longer median absence than all-source days-away cases.
Which forklift number should I use?
Use 84 for primary-source deaths (2024), 25,110 for estimated private-industry DART cases (2023–2024 combined), and 15,460 for estimated private-industry days-away cases (2023–2024 combined). All three use the forklift, order-picker and powered-platform-truck category. Say the year, and say “two-year estimate” for the nonfatal numbers.
Scroll horizontally to view all columns.
| What you need to say | Use | Period | Who it covers |
|---|---|---|---|
| Deaths in the latest checked BLS year | 84 primary-source deaths | 2024 | All CFOI ownerships |
| Historical average deaths per year | About 72 primary-source deaths a year (1,002 ÷ 14); not a forecast | 2011–2024, crossing the 2023 coding break | All CFOI ownerships |
| Cases involving days away, restriction or transfer | 25,110 estimated DART cases; arithmetic average 12,555 a year | 2023–2024 combined | Private industry |
| Cases involving days away | 15,460 estimated cases; arithmetic average 7,730 a year | 2023–2024 combined | Private industry |
| Middle length of absence among days-away cases | Median 18 calendar days (8 for all-source cases) | 2023–2024 | Private industry |
| Deaths counted using BLS’s broader historical involvement definition | 614 primary-or-secondary-source deaths | 2011–2017 | All CFOI ownerships |
| "About 85 deaths and 34,900 serious injuries a year" | Don't. It's a 1995 OSHA estimate. | Published 1995 | — |
Sources: BLS CFOI, BLS DART, BLS DAFW, BLS historical factsheet and OSHA’s 1995 proposal. Averages calculated by Uptime Dock & Door Research. The forklift category includes order pickers and powered platform trucks; historical involvement uses the factsheet’s broader definition. Checked September 29, 2026.
Why do some sources show 25,330 instead of 25,110? BLS estimates 25,330 forklift-category DART cases across all ownerships covered by SOII, versus 25,110 in private industry. Both cover 2023–2024. The broader survey coverage includes state and local government but still excludes some workers, so it is not every U.S. worker. (BLS coverage)
Where did "85 deaths and 34,900 serious injuries" come from?
The figure traces back to a proposed OSHA rule on forklift operator training, published in the Federal Register on March 14, 1995. Section VIII prints all three figures together: 85 deaths, 34,900 serious injuries and 61,800 non-serious injuries. Section V prints a different combination: 107 deaths, 33,800 serious injuries and the same 61,800 non-serious injuries.
You've probably seen the line: forklifts cause about 85 deaths, 34,900 serious injuries and 61,800 non-serious injuries a year. It's on training sites, vendor blogs, law firm pages and even research papers, usually credited to "OSHA."
The earliest source we found is OSHA's proposed rule of March 14, 1995 (60 FR 13782). That's 31 years ago. And when you read the whole document, you find that OSHA itself printed two different sets of estimates. The familiar trio was not stitched together by a later writer.
Scroll horizontally to view all columns.
| Estimate A (Sections I.e and VIII) | Estimate B (Section V) | |
|---|---|---|
| Deaths per year | 85 | 107 |
| Serious injuries per year | 34,900 | 33,800 |
| Non-serious injuries per year | 61,800 (Section VIII) | 61,800 |
| Years behind it | Section VIII says “since 1981,” without giving the ending year | 1981–1990 average |
| How OSHA built it | Regulatory analysis; Table 13 lists 85 deaths and 34,902 injuries before the 34,900 rounding | Estimated forklift share of OSHA accident data (4.8% of deaths, 3.5% of serious and 2.4% of non-serious injuries) |
Source: OSHA, Powered Industrial Truck Operator Training, proposed rule, 60 FR 13782, March 14, 1995. Checked September 29, 2026.
OSHA itself says the two estimates use slightly different definitions. The version often quoted today is present in Section VIII. The problem is treating that historical estimate as a current measurement, not combining figures the agency never combined.
The 1998 final rule used a later regulatory baseline of 101 fatalities and 94,570 injuries a year, and a fleet estimate of 998,671 powered industrial trucks. That analysis had different coverage and methods, including general industry, construction and maritime. These are historical regulatory estimates too, not replacement current counts.
Is "85 deaths a year" still about right?
By coincidence, it's close for 2024, when BLS counted 84. But the arithmetic average across 2011–2024 was lower, about 72, and spans the 2023 coding break. And the two numbers come from different counting methods, decades apart. If you need a current death count, use BLS's.
The checked current BLS data do not use the old “34,900 serious injuries” definition. BLS’s 25,110 private-industry DART cases over two years measure something different. Do not set them side by side as a trend.
What percentage of forklifts have an accident each year?
This audit did not establish a current U.S. truck-level accident percentage: it would need matched accident and fleet data. In its 1995 proposal, OSHA estimated about 8% of powered industrial trucks had an accident each year. Dividing its historical injury figures by its truck estimate produces about 11%, but that is not the share of trucks in accidents.
Here's how OSHA did it in 1995. It added up Estimate B: 107 deaths, 33,800 serious injuries and 61,800 non-serious injuries. Then it divided by 1.4, because its records showed about 1.4 injuries per accident. That gave about 68,400 accidents. Divide by 855,900 trucks and you get about 8%.
We can reproduce a number close to “11%” by adding 85 + 34,900 + 61,800 = 96,785 fatal and nonfatal injury outcomes, then dividing by the same 855,900 trucks. The agency printed those three inputs together in Section VIII. This reconstructs the arithmetic; it does not establish who first made the circulating claim.
Scroll horizontally to view all columns.
| OSHA’s 1995 math | Our reconstruction of the “11%” figure | |
|---|---|---|
| Top number | 68,400 estimated accidents | 96,785 estimated fatal and nonfatal injury outcomes |
| Divided by | 855,900 trucks | 855,900 trucks |
| Result per 100 trucks | About 8.0 accidents (7.99 before rounding) | 11.3 injury outcomes, not 11.3 trucks with accidents |
| Multiply by an assumed 8-year life | “Almost two-thirds” (about 64%), under OSHA’s no-repeat-accident assumption | 90.5 injury outcomes per 100 trucks; not a lifetime accident probability |
Source: OSHA, 60 FR 13782 (March 14, 1995), Sections V and VIII. Arithmetic reconstructed by Uptime Dock & Door Research. OSHA’s annual truck-share estimate assumes at most one accident per truck in a year; its lifetime estimate assumes no truck has more than one accident over its life. Neither is a current observed risk. Checked September 29, 2026.
Source: OSHA, 60 FR 13782 (March 14, 1995), Sections V and VIII. Arithmetic: Uptime Dock & Door Research. Checked Sept. 29, 2026.
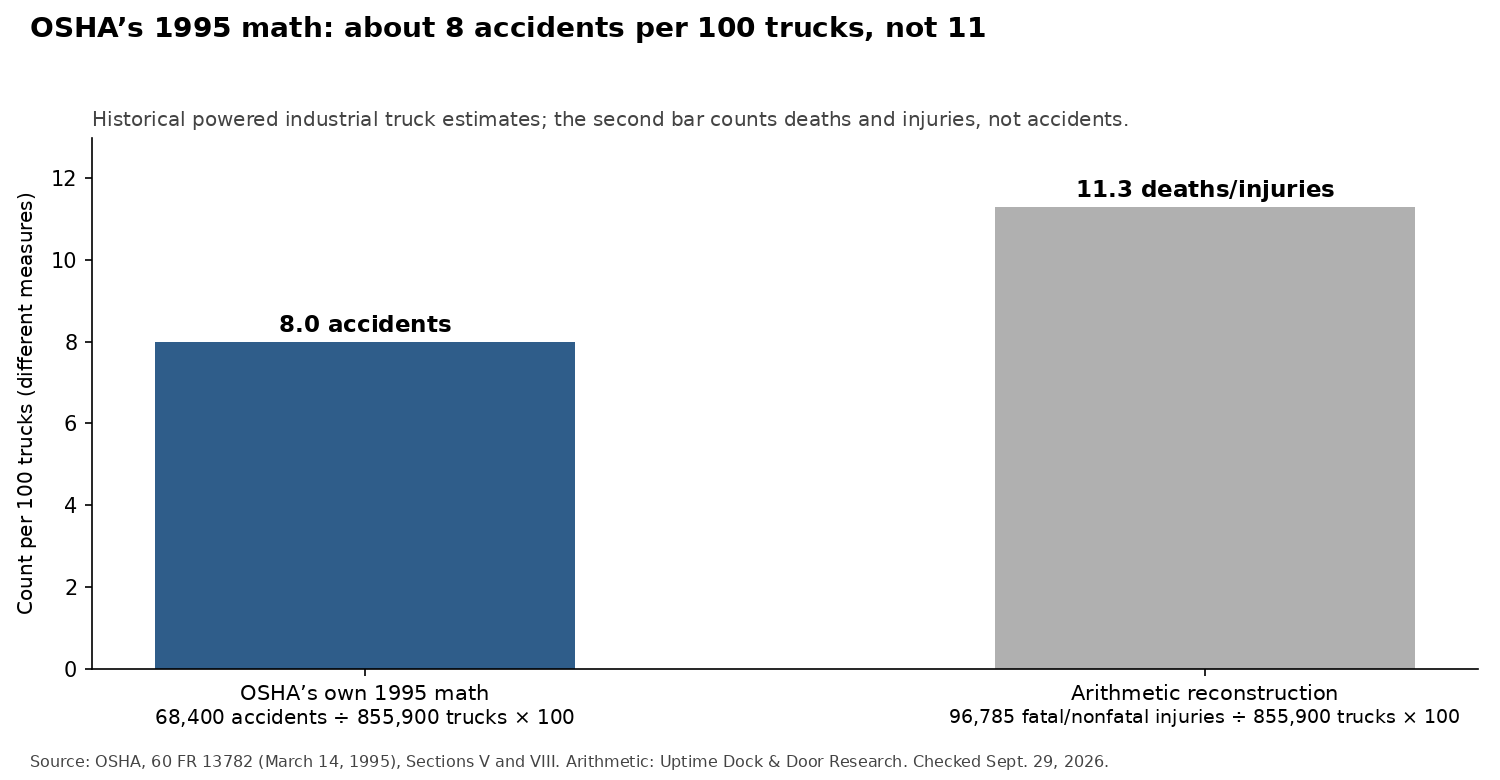
View supplied WebP chart image
Even the truck estimates need their scope. The same 1995 document gives 822,830 trucks in Section II and 855,900 in Section V; its regulatory analysis gives 822,831. Section VI says close to 1.5 million operators, while Section IX describes about 1.2 million. Multiplying either main 1995 fleet estimate by its 1.5-operators-per-truck assumption does not produce 1.5 million. OSHA’s 1998 final rule used a broader estimate of 998,671 trucks. None of these is current.
What is the most common fatal forklift accident?
In BLS data for 2011–2018, 311 of 551 U.S. primary-source deaths in the forklift, order-picker and powered-platform-truck category (56.4%) were transportation incidents. That group includes 112 pedestrian vehicular deaths (20.3%) and 77 nonroadway jackknife or overturn deaths (14.0%). Another 109 were coded “struck by powered vehicle—nontransport” (19.8%), and 96 were falls to a lower level (17.4%).
We used 2011–2018 because BLS published every one of these event counts in those eight years. In later years, many cells are blank because the numbers were too small or didn't meet BLS publication rules. Blank means "not published," never zero.
Scroll horizontally to view all columns.
| How the death happened (BLS event) | Deaths | Share of 551 |
|---|---|---|
| Transportation incident (all kinds) | 311 | 56.4% |
| — of which: off-road incidents (nonroadway) | 185 | 33.6% |
| —— Of the nonroadway group: overturned or jackknifed | 77 | 14.0% |
| — Of the transportation group: pedestrian vehicular incident | 112 | 20.3% |
| Struck by powered vehicle—nontransport | 109 | 19.8% |
| Fell to a lower level | 96 | 17.4% |
Source: BLS CFOI original series for transportation incidents, nonroadway incidents, pedestrian incidents, nontransport struck-by cases, falls and nonroadway jackknife/overturn cases. U.S. workers across CFOI ownerships; forklifts, order pickers or powered platform trucks as primary source. Eight-year sums and shares calculated by Uptime Dock & Door Research. Nonroadway and pedestrian rows are subsets of transportation; overturn/jackknife is a subset of nonroadway. The rows do not add to 100%. Exact annual inputs are in the CSV. Checked September 29, 2026.
So where did "42% of forklift deaths are tip-overs" come from? From 22 deaths in 53 OSHA case files covering 1980–1986, summarized in a June 1990 OSHA report. OSHA reprinted it in its 1995 and 1998 rulemakings. A second old figure, about 24%, is 41 of 170 deaths in 1991–1992. Both are real. Both are old. The 2011–2018 figure is 14.0% for nonroadway jackknife or overturn events among primary-source cases. Its event definition and population differ from those older figures, so it is not a like-for-like replacement or proof that overturn risk fell.
You may also see "36% of forklift deaths involve pedestrians." We did not establish a primary source for that 36% claim. In BLS’s 2011–2018 primary-source counts for the forklift category, pedestrian vehicular incidents were 20.3% of deaths. That event label does not assign blame to the pedestrian.
Who dies in forklift accidents?
Among the broad industry groups compared here, trade, transportation and utilities had the most U.S. forklift-category primary-source deaths in 2011–2018 (209 of 551, or 37.9%), followed by manufacturing (132, or 24.0%) and construction (90, or 16.3%). In 2024, construction had 23 of the 84 deaths (27.4%), up from 13 of 67 in 2023.
Scroll horizontally to view all columns.
| Industry | 2011–2018 | 2023 | 2024 |
|---|---|---|---|
| Trade, transportation and utilities | 209 | not published | not published |
| — Transportation and warehousing | (included above) | not published | 11 |
| — Retail trade | (included above) | not published | 8 |
| Manufacturing | 132 | 20 | 13 |
| Construction | 90 | 13 | 23 |
| All forklift deaths | 551 | 67 | 84 |
Source: BLS CFOI original historical trade/transportation/utilities, manufacturing and construction series, plus current construction, manufacturing, transportation/warehousing and retail series. All CFOI ownerships; forklift, order-picker and powered-platform-truck primary-source category. Sums calculated by Uptime Dock & Door Research. The periods span the 2023 coding break. Subgroups are included in their parent group; the selected rows are not a complete industry total. Checked September 29, 2026.
Construction’s 23 is the highest yearly count returned by the checked construction series for 2011–2024. (The 2020 construction value was not published in that series, and the coding changes in 2023.) Construction also accounted for 10 of the 17 extra deaths between 2023 and 2024. That's one year of small numbers, so treat it as something to watch, not a trend.
Nonfatal cases look different. In 2023–2024, an estimated 920 of the 25,110 private-industry forklift-category DART cases (3.7%) were in construction. Trade, transportation and utilities had 14,100 (56.2%), and manufacturing had 7,530 (30.0%). These are shares of cases, not risk rates for workers in those industries.
Why do two different BLS forklift death counts exist?
BLS’s historical forklift tables use two source-role definitions. For U.S. work deaths in 2011–2017, the primary-source series gives 466. The broader primary-or-secondary-source involvement definition gives 614. That is 31.8% more, a difference in definitions rather than a change over time.
Scroll horizontally to view all columns.
| Year | Forklift category was the primary source | Forklift was a primary or secondary source | Difference |
|---|---|---|---|
| 2011 | 66 | 87 | +21 |
| 2012 | 68 | 93 | +25 |
| 2013 | 70 | 90 | +20 |
| 2014 | 65 | 85 | +20 |
| 2015 | 71 | 94 | +23 |
| 2016 | 72 | 91 | +19 |
| 2017 | 54 | 74 | +20 |
| Total | 466 | 614 | +148 |
Sources: Primary source — BLS CFOI original series. Involved — BLS factsheet and its chart 1 data table, published June 10, 2019. Both cover U.S. work deaths across CFOI ownerships. Differences calculated by Uptime Dock & Door Research. Checked September 29, 2026.
Here is an example of what can land in the gap. Say a load slides off the forks and hits someone. Depending on the incident and coding rules, the load can be the primary source and the forklift the secondary source. Such a death appears in the broader “involved” count but not in the forklift primary-source count.
Both counts are correct. Just say which one you are using. The claim “more than 600 forklift deaths from 2011 to 2017” is accurate on the historical “involved” basis.
For 2024, BLS separately reports 84 primary-source deaths and 32 secondary-source deaths. Do not add them and call 116 the number of forklift-involved deaths: these separate series do not establish a deduplicated combined total.
Does training prevent 70% of forklift accidents?
The study behind this claim did not measure 70% fewer accidents. In its second warehouse study, the mean observed behavior-error proportion for 48 operators fell from 0.23 before training and feedback to 0.07 at a later check, a drop of about 70%. OSHA’s 1995 proposal separately estimated that 20% to 25% of powered-industrial-truck accidents were at least partly caused by inadequate training; that was not a measured prevention rate.
The paper, by H. Harvey Cohen and Roger C. Jensen in the Journal of Safety Research (1984), describes two studies at separate warehouses. The second tracked 14 measurable driving behaviors, like sounding the horn at blind corners. Its mean error proportion was 0.23 before training, 0.09 just after it, and 0.07 at a retention check three months later: (0.23 − 0.07) ÷ 0.23 × 100 = 69.6%, or about 70%. That is a real behavior result. But OSHA, summarizing it in the 1995 proposal, said a drop in errors cannot be directly equated to the same drop in accidents.
Where did the other famous forklift numbers come from?
We audited 15 widely repeated forklift figures. Many appear in OSHA’s 1995 proposal, a 1984 study or later agency documents. Four can be reconstructed with arithmetic on old estimates, but that does not establish who first published them. The 614-death figure is accurate for its stated historical period; none of these 15 is a current annual count.
Scroll horizontally to view all columns.
| The figure | Earliest source we found | What it really measured | Use this instead |
|---|---|---|---|
| About 85 deaths a year | OSHA proposal, March 14, 1995 | An estimate made to support a training rule | 84 deaths (2024) |
| 34,900 serious injuries a year | Same sentence, 1995 | Same estimate | 25,110 cases, 2023–2024 combined (a different measure) |
| 61,800 non-serious injuries a year | Same proposal, Sections V and VIII | Printed with both sets of agency estimates | No current like-for-like estimate established here |
| Over 11% of forklifts crash each year | Origin not established; arithmetic reconstructed from 1995 inputs | Deaths and injuries ÷ trucks, not trucks with accidents | No current truck-level percentage established; OSHA’s historical estimate was about 8% under its assumption |
| 90% of forklifts crash in their lifetime | Origin not established; arithmetic reconstructed from 1995 inputs | Unrounded 11.3 injury outcomes per 100 trucks × 8 years | Neither this nor OSHA’s “almost two-thirds” is a current measured lifetime probability |
| 855,900 forklifts in the U.S. | 1995 proposal, credited to the Industrial Truck Association | A historical powered-industrial-truck fleet estimate | No current matched fleet estimate established in this audit |
| 1.5 million forklift operators | 1995 proposal, Section VI | A historical operator estimate; other sections describe about 1.2 million | No current figure on the same basis established here |
| 42% of deaths are tip-overs | OSHA report, June 1990, reproduced in the 1995 proposal | 22 of 53 fatality case files, 1980–1986 | Historical only; the 14.0% nonroadway jackknife/overturn share for 2011–2018 is a different measure |
| About 24% are overturns | BLS article (1994), reproduced in the 1995 proposal | 41 of 170 powered-industrial-truck deaths, 1991–1992 | Historical only; not directly comparable with the narrower 2011–2018 nonroadway category |
| Training prevents 70% of accidents | Cohen & Jensen, 1984 | Mean behavior-error proportion in the second warehouse study, after training and feedback | About 70% fewer observed behavior errors, not 70% fewer accidents |
| 35,000 serious and 62,000 non-serious injuries | OSHA Region I notice, 2018 (expired 2019) | Stated figures match rounded 1995 estimates, but the notice does not establish that origin | 25,110 estimated private-industry DART cases, 2023–2024; a different measure |
| 97,000 or “nearly 100,000” injuries | Origin not established; arithmetic reconstructed | 35,000 + 62,000 | 25,110 estimated private-industry DART cases, 2023–2024; a different measure |
| 95 serious injuries a day; a death every 4 days | Origin not established; arithmetic reconstructed | 34,900 ÷ 365 = 95.6, rounding to 96; 365 ÷ 85 = 4.3 | 84 primary-source deaths in 2024, or one per 4.4 calendar days on average; not actual incident spacing |
| 96 forklift deaths in 2015 | OSHA Region I notice, 2018 | Claim does not match the checked BLS counts; difference unresolved | 71 primary-source deaths or 94 primary-or-secondary-source involved deaths in 2015 |
| More than 600 deaths, 2011–2017 | BLS fact sheet, 2019 | Forklift-involved deaths | Accurate: 614 (involved basis) |
Sources: OSHA, 60 FR 13782 (1995); OSHA, 63 FR 66238 (1998); OSHA Regional Notice CPL 04-00-023F; BLS fact sheet (2019); BLS Census of Fatal Occupational Injuries. Full ledger with math in the download. Checked September 29, 2026.
That 2018 notice deserves a word. It was a Boston-region local enforcement notice that expired on September 30, 2019, and CPL 04-00-023G canceled it effective October 1, 2019. It is where the rounded “35,000 and 62,000” pair shows up. It makes national claims, but it is a regional enforcement notice, not a national statistical release. Its 96-death claim for 2015 does not match either the checked BLS primary-source count of 71 or the broader involved count of 94; we did not reconcile that difference.
Are forklift accidents going up or down?
U.S. primary-source deaths in the forklift, order-picker and powered-platform-truck category rose from 67 in 2023 to 84 in 2024, up 25.4%. That is a count change, not an exposure-adjusted risk change. BLS switched to a new coding system in 2023, and yearly counts have swung between 54 and 85 since 2011, so one year’s jump is not a trend.
From 2011 to 2022, under the old system, deaths averaged 70.9 a year with no steady direction. The two highest years were 2018 (85) and 2024 (84). Annual private-industry days-away estimates ranged from 6,130 to 8,140 in 2011–2020. BLS then published two-year estimates: 15,480 in 2021–2022 and 15,460 in 2023–2024. Do not turn those two-year values into measured single-year counts or join them across the coding break as a clean trend.
How often does OSHA cite forklift violations?
OSHA’s Powered Industrial Trucks standard (29 CFR 1910.178) ranked 8th on its list of most-cited standards in federal OSHA inspections across all industries for fiscal year 2025, October 1, 2024 through September 30, 2025.
The rule covers truck design, fueling and charging, maintenance, safe driving and operator training. OSHA's Top 10 page lists the rank. It does not list the citation count, so this page reports only the official rank, not an unverified count from another publisher.
What do these numbers say about a loading dock?
They can't tell you how many forklift deaths or injuries happened at loading docks, and they can't tell you how safe any one building is. They're national totals, not a diagnosis of a facility.
What the data can do is point you at the equipment where forklifts, trailers and people meet. If your dock handles trailers, see how vehicle restraints and wheel chocks compare for keeping trailers from rolling away and how much weight a dock leveler is rated to carry. For warehousing-and-storage industry numbers, rather than an equipment category across industries, see our warehouse injury statistics.
If a leveler, dock plate or door where forklifts cross isn't working right, Uptime's pages on loading dock repair and dock leveler repair explain how to find service in your area. Before you call anyone, our free guide on what to tell a repair company walks through what to write down first.
Why this matters now
Two reasons. BLS released its 2024 fatal-injury data on February 19, 2026, and the forklift-category death count was the second-highest published count in the 2011–2024 series, which spans a coding break. Meanwhile, the “85 deaths and 34,900 injuries” estimate dates to 1995, more than 30 years ago. If you are writing a safety plan, a news story or a grant, the current counts and their limits are easy to use now.
How we built this
Here's exactly what we did.
What we collected. BLS forklift-category death counts for 2011–2024 and nonfatal estimates for 2011–2024, including detailed 2023–2024 estimates for forklift-category and all-source cases. We checked each published numeric row against BLS’s own public API, not just the National Safety Council’s republication. We read the codebooks for source, case type, ownership and reporting period, plus BLS’s June 2019 forklift factsheet. The CSV names each exact series and supplies a working query URL.
What we checked in the original documents. OSHA’s 1995 proposed rule on forklift operator training (60 FR 13782), its 1998 final rule (63 FR 66238), the archived Region I notice CPL 04-00-023F and the notice that canceled it, and Cohen and Jensen’s 1984 paper. We traced each retained claim to the relevant passage or table, rather than treating a later summary as proof.
What we calculated. Totals, averages, shares, ratios and reconstructions of circulating figures. Every calculation has its full formula and source links in the dataset, including the annual inputs behind the eight-year event and industry totals. For example, the leg-and-foot shares are 11,780 ÷ 25,110 × 100 and 706,260 ÷ 2,983,110 × 100. The ratio uses those unrounded shares, not the rounded 46.9% and 23.7%. The all-source group includes forklift cases.
How to reproduce it. Open a row’s BLS query URL, match its series ID and stored year, and read the returned value with the linked codebook. FW covers the older fatal series and FA the current one. CS contains the annual 2011–2020 nonfatal series; CB covers 2021–2022; CA covers 2023–2024. For CB and CA, the stored year is the ending year of the two-year period. Run the formula in a calculated row on its cited inputs. Source counts are rounded survey estimates where noted; our percentages are descriptive calculations, not significance tests or individual risk predictions.
When. Checked September 29, 2026. Queries for the current primary-source fatal and private-industry DART series through 2026 returned no later observations than 2024. That stored year means 2024 for deaths and 2023–2024 for nonfatal cases.
What we did not do. We did not survey anyone, inspect a facility or test equipment. Current work-injury counts and estimates come from BLS. Historical figures come from the named agency documents or original research paper. Our contribution is the source audit, structured compilation and disclosed calculations, not new field observations.
What this data does and doesn’t show
- It counts cases, not people or accidents. One accident can hurt two people. One person can have two cases.
- The death and nonfatal populations differ. CFOI deaths cover multiple ownership types and self-employed workers; the main nonfatal tables cover private industry. The separately labeled 25,330 estimate uses all SOII-covered ownerships. These are not interchangeable populations.
- There is no current rate per forklift in this register. This audit did not establish matched U.S. accident, fleet or operating-hour data for such a rate.
- 2023 is a break. BLS changed how it codes events and sources starting that year. Compare across it with care.
- Blank is not zero. An unavailable value may reflect publication standards, confidentiality, reliability or the absence of that series. This register does not infer zero from a blank.
- Nonfatal BLS figures and the 1995 regulatory figures are estimates. They come from different methods and populations, not one interchangeable set of accident counts.
- "Earliest source we found" isn't proof that nothing older exists.
- It does not show why a year went up or down.
- No comparable state table was assembled here. A list of selected OSHA reports is not a substitute for a complete, matched state-level forklift injury dataset.
How to cite this page
Uptime Dock & Door Research. "Forklift Accident Statistics: 84 U.S. Deaths in 2024, Injuries and Where the Numbers Come From." Uptime Dock & Door. Updated September 2026. https://uptimedockanddoor.com/research/forklift-accident-statistics/
To cite a single finding, this wording works as written:
The "85 deaths and 34,900 serious injuries a year" still quoted on many sites traces back to a 1995 OSHA proposal, according to Uptime Dock & Door Research.
An estimated 46.9% of U.S. private-industry DART cases involving forklifts, order pickers and powered platform trucks in 2023–2024 involved the legs or feet, compared with 23.7% of all-source DART cases, according to Uptime Dock & Door Research’s analysis of BLS estimates. DART means days away, restricted work or job transfer; the all-source group includes forklift cases.
For the underlying counts and historical estimates, keep the agency attribution: the U.S. Bureau of Labor Statistics or OSHA. The statistical statements, tables and sections have stable anchors for a precise reference.
Reuse: You may reuse Uptime’s original table layouts, calculations, charts and source-audit wording with credit to Uptime Dock & Door Research; preserve the underlying source attribution and any source-specific terms. This does not license third-party material.
Download the data
Two free files, no sign-up. Every row lists its source, link and check date. Rows we calculated show the formula.
- uptime-forklift-statistics-2026-09.csv — 255 rows: the original 110 records plus the annual inputs and supporting records needed to reproduce the tables, charts and calculations, including both BLS death definitions, the injury profile, historical estimates and the official citation rank.
- uptime-forklift-statistic-origins.csv — 15 rows: the famous figures audited here, with verified origins or explicit limits where the origin remains unknown.
Common questions
How many people die in forklift accidents each year?
84 U.S. workers died in 2024 with a forklift, order picker or powered platform truck as the primary source of the fatal injury, according to BLS. From 2011 through 2024, yearly counts ranged from 54 to 85 and averaged about 72, spanning a coding break in 2023. No 2025 death count was returned by this series when queried on September 29, 2026.
How many forklift injuries happen each year?
BLS estimates 25,110 U.S. private-industry cases with days away, restricted work or a job transfer in 2023 and 2024 combined for forklifts, order pickers and powered platform trucks. That is 12,555 a year as an arithmetic average, not an observed count for either year. An estimated 15,460 involved days away after the day of injury or illness.
What does OSHA say about forklift accident statistics?
The widely quoted 85 deaths and 34,900 serious injuries a year appear in OSHA’s 1995 proposal. For the current checked death count, use BLS: 84 U.S. primary-source work deaths in the forklift, order-picker and powered-platform-truck category in 2024. The old regulatory estimates and current BLS categories are not interchangeable.
What is the most common cause of fatal forklift accidents?
In the checked 2011–2018 BLS data, transportation incidents made up 56.4% of U.S. primary-source deaths in the forklift category. Pedestrian vehicular incidents were 20.3%, nontransport struck-by-powered-vehicle cases 19.8%, falls to a lower level 17.4%, and nonroadway jackknife or overturn cases 14.0%. Pedestrian and overturn cases are included in transportation, so those percentages cannot all be added. These are historical event categories, not a current fault or preventability ranking.
Are 36% of forklift deaths pedestrians?
This audit did not establish a primary source for the 36% claim. In BLS’s 2011–2018 primary-source counts for forklifts, order pickers and powered platform trucks, pedestrian vehicular incidents made up 112 of 551 U.S. work deaths, or 20.3%. That event label does not mean the pedestrian caused the incident.
What percentage of forklifts have an accident each year?
This audit did not establish matched current U.S. accident and fleet data for that percentage. OSHA’s 1995 proposal estimated about 8%, assuming no truck had more than one accident that year. Dividing its historical deaths-plus-injuries estimate by its fleet estimate reconstructs about 11.3 injury outcomes per 100 trucks, not the percentage of trucks in accidents.
Are forklift accidents increasing?
U.S. forklift-category primary-source deaths rose from 67 in 2023 to 84 in 2024. The increase in counts is 25.4%, not a measured change in risk per worker or truck. The major coding break starts in 2023, and one year does not establish a trend. Annual private-industry days-away estimates ranged from 6,130 to 8,140 in 2011–2020; later nonfatal estimates cover two-year periods.
Can these numbers tell me how risky my facility is?
No. They're national totals. They don't include how many forklifts, hours or people your site has. A qualified safety professional can assess a specific workplace.
Sources
- U.S. Bureau of Labor Statistics, Census of Fatal Occupational Injuries: original 2011–2020, 2021–2022 and 2023–2024 forklift-category primary-source series. Exact event, industry and secondary-source series are linked beside the tables and in the CSV. Checked September 29, 2026.
- U.S. Bureau of Labor Statistics, Survey of Occupational Injuries and Illnesses: original 2011–2020 annual DAFW, 2021–2022 DAFW, 2021–2022 DART, 2023–2024 DART, DAFW and DJTR series. Every profile numerator, comparator and median has its exact API link in the CSV. Checked September 29, 2026.
- National Safety Council, Injury Facts, Work Safety: Forklifts — Data Details. Secondary cross-check and discovery source; final numeric verification used the BLS records listed above. Checked September 29, 2026.
- U.S. Bureau of Labor Statistics, Occupational Injuries, Illnesses, and Fatalities Involving Forklifts and its chart 1 data, published June 10, 2019. Checked September 29, 2026.
- OSHA, Powered Industrial Truck Operator Training, proposed rule, 60 FR 13782, March 14, 1995. Relevant passages: Sections I.e, II, IV.B, V, VI, VIII and IX; Tables 1, 5 and 13. Checked September 29, 2026.
- OSHA, Powered Industrial Truck Operator Training, final rule, 63 FR 66238, December 1, 1998. Regulatory-analysis fleet estimate and Table 12 baseline. Checked September 29, 2026.
- OSHA, Top 10 Most Frequently Cited Standards, fiscal year 2025, federal OSHA inspections across all industries. Rank only. Checked September 29, 2026.
- OSHA, Regional Notice CPL 04-00-023F, effective October 1, 2018, and CPL 04-00-023G, effective October 1, 2019, which canceled it. Historical enforcement documents, not current statistical releases. Checked September 29, 2026.
- H. Harvey Cohen and Roger C. Jensen, “Measuring the Effectiveness of an Industrial Lift Truck Safety Training Program”, Journal of Safety Research 15(3):125–135 (1984). Original paper, especially Study 2 and Table 6; also summarized in source 5. Checked September 29, 2026.
- U.S. Bureau of Labor Statistics, SOII concepts and coverage, CA nonfatal codebook, CA case types, CA ownerships, CA source categories and CA characteristics. Checked September 29, 2026.
- U.S. Bureau of Labor Statistics, OIICS manual and version history; FW historical fatal codebook, FW source categories, FW characteristics, FA current fatal codebook and FA source-role cases. Checked September 29, 2026.
- U.S. Bureau of Labor Statistics, CS annual nonfatal codebook, CS case types and CB 2021–2022 dataset directory. The CB values were verified directly through the API queries in source 2. Checked September 29, 2026.
- U.S. Bureau of Labor Statistics, 2024 fatal-injury release, published February 19, 2026. Checked September 29, 2026.
- OSHA, 29 CFR 1910.178 — Powered industrial trucks. Current standard linked for scope, not instructions for hazardous work. Checked September 29, 2026.
This page is educational research, not safety, legal or compliance advice.
Uptime Dock & Door Research is the research and reference section of uptimedockanddoor.com.