Warehouse Injury Statistics: the 2024 Federal Numbers, and Which Warehouses They Count
In 2024, U.S. private-industry warehousing and storage employers reported an estimated 77,000 nonfatal injuries and illnesses, at 4.8 cases per 100 full-time-equivalent workers, according to BLS. A separate BLS census recorded 32 fatal work injuries in this industry. These figures cover establishments classified in warehousing and storage, NAICS 493—not every building with a loading dock. Nonfatal sources · Case counts · Fatal source
Key figures
Each line below carries its population, period and source. ★ Source-reported means the figure is printed in the cited source. ● Calculated means we calculated it from source-reported inputs, with the formula shown. NAICS is the North American Industry Classification System, which groups establishments by their activity.
- 77,000 nonfatal injury and illness cases — warehousing and storage (NAICS 493), U.S. private industry, 2024. ★ Source-reported: BLS Survey of Occupational Injuries and Illnesses (SOII), Table 2.
- 4.8 cases per 100 full-time-equivalent workers — U.S. private-industry warehousing and storage (NAICS 493), 2024, against 2.3 for all private industry. ★ Source-reported: BLS SOII, Table 1.
- 2.1 times the private-industry total-recordable rate — U.S. warehousing and storage (NAICS 493), 2024; 4.8 ÷ 2.3. ● Calculated: Uptime calculation from published BLS rates.
- 66,800 of 77,000 recordable warehouse cases (86.8%) involved days away, restricted work or a job transfer — U.S. private-industry NAICS 493, 2024. Across all private industry the share was 58.5%. ● Calculated: 66,800 ÷ 77,000 × 100 and 1,455,600 ÷ 2,488,400 × 100, from BLS case counts.
- 62.9% of warehouse cases involving days away, restriction or transfer were restriction/transfer-only cases — U.S. private-industry NAICS 493, 2024. Across private industry the split ran the other way: 61.0% involved days away. ● Calculated: 42,000 ÷ 66,800 × 100 and 888,100 ÷ 1,455,600 × 100, from BLS case counts.
- The warehouse restriction/transfer-only rate was 5.2 times the private-industry rate — 2.6 versus 0.5 cases per 100 full-time-equivalent workers, U.S. private-industry NAICS 493, 2024. The days-away rate ratio was 1.88. ● Calculated: 2.6 ÷ 0.5 and 1.5 ÷ 0.8, from BLS rates.
- 32 fatal work injuries in U.S. private-industry warehousing and storage (NAICS 493) in 2024, up from 28 in 2023. ★ Source-reported: BLS Census of Fatal Occupational Injuries (CFOI), 2024 and 2023.
- Warehouse-industry fatalities were 0.6% of all 5,070 U.S. fatal occupational injuries in 2024 — private-industry NAICS 493 fatalities divided by the national CFOI total. ● Calculated: 32 ÷ 5,070 × 100, from BLS CFOI. This is a share of deaths, not a worker fatality rate.
- The broader transportation and warehousing sector reported 261,500 nonfatal injury and illness cases and 865 fatal occupational injuries in 2024 — U.S. private industry, NAICS 48–49. Warehousing and storage was 29.4% of the sector's nonfatal cases: 77,000 ÷ 261,500 × 100. ★ Source-reported / ● Calculated share: BLS SOII and CFOI.
- A warehouse statistics category is not the same thing as a warehouse-law definition. Our six-authority crosswalk separates the BLS industry measure, OSHA inspection scope and four state definitions, checked September 17, 2026.
- General warehousing ran 4.9 and refrigerated warehousing 3.4 nonfatal injury and illness cases per 100 full-time-equivalent workers in 2024 — U.S. private industry, NAICS 49311 and 49312. ★ Source-reported: BLS SOII. The warehouse-type table adds sampling uncertainty.
- In 1952 the historical warehousing rate was 36.4 disabling injuries per million employee-hours — equivalent to 7.28 disabling injuries per 200,000 hours. ★ Source-reported / ● Calculated conversion: BLS Bulletin No. 1174, U.S. warehousing and storage, 1952; 36.4 × 0.2. That changes the units, not the old case definition or survey population.
Uptime Dock & Door Research · Data years: 2024 (nonfatal and fatal), with 2022–2024 series and selected 1948–1952 historical figures · Last verified: September 2026
Contents
- How many warehouse injuries are reported each year?
- Which "warehouse" do these numbers actually cover?
- How does warehousing compare with other industries?
- Do most warehouse DART cases involve days away?
- How do rates differ by type of warehouse?
- What counts as a good injury rate for a warehouse?
- How many warehouse workers die on the job?
- What actually hurts warehouse workers
- Is OSHA targeting warehouses?
- Where the injury rate becomes a legal trigger
- What warehouse injury statistics looked like in 1950
- Five warehouse claims that don't hold up
- What these numbers can't tell you
- Methodology
- Sources
- How to cite this page
- Download the data
- Common questions
How many warehouse injuries are reported each year?
U.S. private-industry warehousing and storage employers reported an estimated 77,000 recordable injuries and illnesses in 2024, at a rate of 4.8 per 100 full-time-equivalent workers. The count has moved a lot in three years; the rate has moved less.
A recordable case is a work-related injury or illness an employer has to log under OSHA's recordkeeping rules. Criteria include medical treatment beyond first aid, days away, restricted work or job transfer, loss of consciousness, and certain significant diagnoses. Full-time-equivalent (FTE) means 2,000 hours worked, not one person on the payroll. OSHA recordability criteria · BLS rate method
Warehousing and storage (NAICS 493), U.S. private industry, 2022–2024
Scroll horizontally to view all columns.
| Data year | Recordable cases | Rate per 100 FTE workers | All private industry, rate |
|---|---|---|---|
| 2022 | 89,900 | 5.5 | 2.7 |
| 2023 | 76,200 | 4.7 | 2.4 |
| 2024 | 77,000 | 4.8 | 2.3 |
Source: U.S. Bureau of Labor Statistics, Survey of Occupational Injuries and Illnesses, Table 1 (rates) and Table 2 (counts), same tables for 2022 rates, 2022 counts, 2023 rates and 2023 counts. All rate columns use cases per 100 FTE. Counts converted from published thousands. Read 2026-09-17.
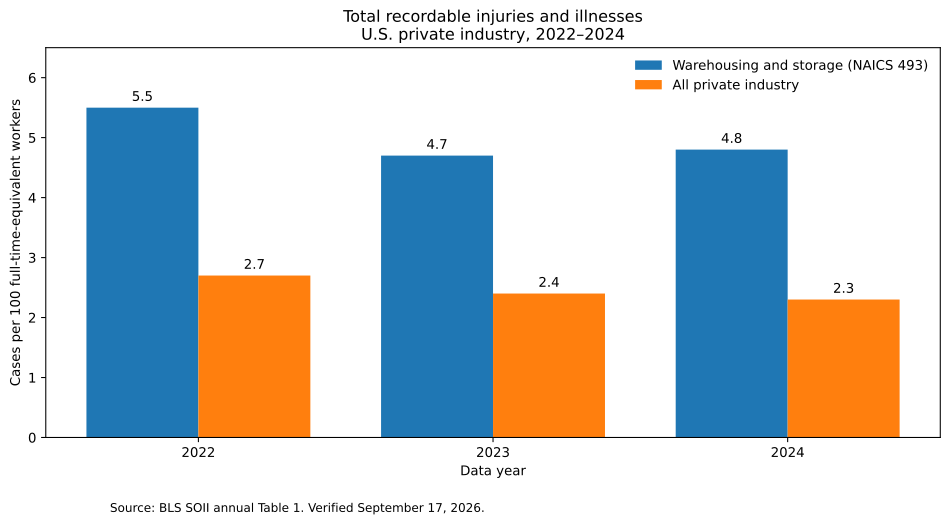
Chart source: BLS SOII annual Table 1, linked in the table above. The chart uses exactly the same six rates.
Between 2022 and 2024 the warehousing rate fell 12.7% and the case count fell 14.3%. That is a description, not an explanation. The survey records what happened; it does not say whether the change came from safer buildings, different work, different staffing, or different recordkeeping.
One thing the rate is not: a percentage of workers hurt. BLS builds it from hours worked, not headcount, and one worker can produce more than one case. A rate of 4.8 does not mean 4.8% of warehouse workers got hurt.
For the record, all private industry reported 2.5 million recordable cases in 2024 — the lowest in a series going back to 2003, according to the BLS news release published on January 22, 2026.
Which "warehouse" do these numbers actually cover?
They cover establishments classified in warehousing and storage, NAICS 493. BLS describes these establishments as operating storage facilities rather than selling the goods they handle.
That describes the establishment's activity, not who owns its parent company. A retailer-owned distribution center can be classified in warehousing. A stockroom inside an establishment classified in retail is not a separate warehouse-industry observation. BLS industry definition · BLS explanation of establishment and auxiliary-unit classification
So when someone asks "how many warehouse injuries are there?", they could mean any of three different populations. Here they are with their actual 2024 numbers. The published rows below are U.S. private industry; nonfatal cases include injuries and illnesses, and deaths are fatal occupational injuries.
Scroll horizontally to view all columns.
| What you might mean | What BLS calls it | Recordable cases, 2024 | Rate per 100 FTE | Deaths, 2024 |
|---|---|---|---|---|
| Establishments classified in warehousing and storage | Warehousing and storage (NAICS 493) | 77,000 | 4.8 | 32 |
| Passenger and freight transportation, related support and warehouses | Transportation and warehousing (sectors 48–49) | 261,500 | 4.4 | 865 |
| Warehouse-type work wherever it happens | Not measured as one population in these industry tables | — | — | — |
Sources: BLS SOII Table 1 and Table 2 for NAICS 493; BLS chart tables for the 2024 release for the sector; BLS Industry at a Glance: NAICS 493 and The Economics Daily, April 2026 for deaths. Read 2026-09-17.
The third row is the honest limit of this comparison. These industry totals do not count "everyone doing warehouse work" wherever the work happens. We are not going to turn them into that number.
Which definition applies to this question?
BLS is not the only body that has had to define a warehouse, and the definitions do not line up. A statistical category, an inspection program and a state law answer different questions.
U.S. warehouse definitions and inspection scope, checked September 17, 2026
Scroll horizontally to view all columns.
| Authority | Instrument | Industry definition or scope |
|---|---|---|
| BLS (injury statistics) | Published SOII estimates for NAICS 493 | General (493110), refrigerated (493120), farm product (493130), and other warehousing and storage (493190); not every subtype is published in every table |
| OSHA (inspection targeting) | National Emphasis Program, CPL 03-00-026, July 31, 2026 revision | OSHA's public scope description names warehousing/distribution centers, mail/postal processing and distribution centers, and parcel delivery/courier services; not a statistical definition of NAICS 493 |
| Minnesota | Minn. Stat. 182.6526, subd. 1(g) | 493110, 423, 424, 454110, 492110 |
| New York | Labor Law 780(8) | 493 except 493130 (farm product), 423, 424, 454110, 492110 |
| California | Labor Code 2100(i) | 493110, 423, 424, 454110 |
| Washington | RCW 49.84.010(12) | 493 except 493130 (farm product), 423, 424, 454110 |
Sources: BLS industry definition and annual SOII tables; OSHA scope description and current directive entry; Minnesota statute; New York statute; California AB 701, chaptered text; Washington statute. This is Uptime's source-grounded crosswalk, not a new agency definition. Employee-size and employee-coverage conditions also apply under the state laws; see state rules. Verified 2026-09-17.
Read the table sideways and the point jumps out. Several state laws include wholesaling and electronic shopping codes outside BLS's NAICS 493 total. Washington and New York include refrigerated and other warehousing while excluding farm-product warehousing; California's listed warehouse code is general warehousing only.
The practical version: match the establishment's code to the question you are answering. The right injury benchmark and the law covering a site are not necessarily based on the same industry list.
How does warehousing compare with other industries?
Warehousing runs a little over twice the private-industry recordable rate, and just under three times the rate of cases involving days away, restriction or transfer. These are nonfatal case rates, not a ranking of fatality risk.
Recordable injury and illness rate, U.S. private industry, 2024
Scroll horizontally to view all columns.
| Industry | Recordable cases | Rate per 100 FTE workers |
|---|---|---|
| Warehousing and storage (NAICS 493) | 77,000 | 4.8 |
| Transportation and warehousing (48–49) | 261,500 | 4.4 |
| Health care and social assistance | 553,800 | 3.4 |
| Retail trade | 339,800 | 3.0 |
| Manufacturing | 332,600 | 2.7 |
| Wholesale trade | 126,800 | 2.2 |
| Construction | 167,100 | 2.2 |
| All private industry | 2,488,400 | 2.3 |
Sources: BLS chart tables for the 2024 SOII release for sector rows; Table 1 and Table 2 for NAICS 493 and the private-industry line. Read 2026-09-17.
Two habits worth breaking. First, compare against your own industry code, not the all-industry average — the spread across codes is wider than most of the differences people argue about. Second, notice that a big case count usually means a big industry. Health care has seven times warehousing's cases and a lower rate.
Do most warehouse DART cases involve days away?
No. Most warehousing DART cases in 2024 involved job transfer or restricted work without days away.
BLS separates these work outcomes into two buckets. Days away from work (DAFW) means at least one day away beyond the day of the injury or illness; the case can also include restricted work or a transfer. Days of job transfer or restriction (DJTR) counts restriction or transfer cases without days away. BLS adds the two together and calls the total DART: days away, restriction or transfer. These categories describe work outcomes, not medical severity. BLS case definitions
Across all private industry, most DART cases are days-away cases. In warehousing, it is the reverse.
Where DART and other recordable cases land, U.S. private industry, 2024
All rates below are cases per 100 FTE; the last three rows are shares of the named case counts.
Scroll horizontally to view all columns.
| Measure | Warehousing (493) | All private industry | Warehousing ÷ private |
|---|---|---|---|
| Recordable rate (per 100 FTE) | 4.8 | 2.3 | 2.09× |
| DART rate | 4.1 | 1.4 | 2.93× |
| Days-away rate | 1.5 | 0.8 | 1.88× |
| Restricted duty or transfer rate | 2.6 | 0.5 | 5.20× |
| Other recordable rate | 0.6 | 1.0 | 0.60× |
| Days-away share of DART cases | 37.1% | 61.0% | — |
| Restricted-duty share of DART cases | 62.9% | 39.0% | — |
| DART share of all recordable cases | 86.8% | 58.5% | — |
Sources: rates from BLS SOII Table 1, 2024; shares calculated by us from the case counts in Table 2, 2024 — 42,000 ÷ 66,800 for warehousing, 567,500 ÷ 1,455,600 for private industry. Ratios are computed from BLS's rounded published rates. Read 2026-09-17.
Two findings fall out of that table.
One: the split is inverted. Warehousing's restriction/transfer-only rate is more than five times the private-industry average, while its days-away rate is under twice. Among DART cases, restriction or transfer without days away makes up a larger share in warehousing than across private industry.
Two: most recordable warehouse cases change work duties or attendance. 86.8% involved days away, restricted work or a transfer. Across private industry it is 58.5%. Warehousing's "other recordable" rate is actually lower than the private-industry average — 0.6 against 1.0 cases per 100 FTE. "Other recordable" does not mean medically minor; it means the case involved neither days away nor restriction or transfer.
Why this matters for anyone quoting a number: compare warehousing with all private industry using days away and the rate is about twice as high. Use the full DART measure and it is nearly three times as high. Both are correct. Say which one you used.
The data cannot tell you why the split runs that way. Light-duty programs, injury type, and job design could all contribute. BLS records the outcome, not the reason.
How do rates differ by type of warehouse?
General warehousing has the highest 2024 point estimate among the published warehouse types. Cold storage runs lower. The historical table below shows a different ordering in a 1950 BLS study, using a different population and injury definition.
Small subsectors come with big uncertainty, so this table carries it. The relative standard error (RSE) is how much the estimate wobbles because it comes from a sample. A 1.7% RSE is tight. A 19.7% RSE is loose enough that the point estimate on its own tells you very little.
Recordable rate by warehouse type, U.S. private industry, 2024
Scroll horizontally to view all columns.
| Warehouse type | NAICS | Cases | Rate per 100 FTE | RSE | Approx. 95% range |
|---|---|---|---|---|---|
| General warehousing and storage | 49311 | 72,900 | 4.9 | 1.7% | 4.74 – 5.06 |
| Refrigerated warehousing and storage | 49312 | 2,400 | 3.4 | 9.3% | 2.78 – 4.02 |
| Other warehousing and storage | 49319 | 1,500 | 2.9 | 19.7% | 1.78 – 4.02 |
| Farm product warehousing and storage | 49313 | not published for 2024 | not published | — | — |
Sources: cases and rates from BLS SOII Table 1 and Table 2 for 2024; relative standard errors from Table A-1. The 95% ranges are our calculation, not BLS output: estimate ± 1.96 × estimate × (RSE ÷ 100). They describe sampling uncertainty only. Read 2026-09-17.
A few things to take from it.
General warehousing has the higher estimate. The two approximate ranges do not overlap — 4.74–5.06 against 2.78–4.02. We have not performed a formal test of the difference, and these intervals do not account for every source of reporting or measurement error.
Do not turn "other warehousing" into a safety ranking. Its approximate rate range runs from 1.78 to 4.02 and overlaps cold storage's range. The point estimate alone does not establish which type is safer.
Farm product warehousing has no 2024 row. It had one in 2023 (4.8) and 2022 (2.8). A missing row means unknown, not zero, and not safe. Never fill it in by subtracting the published types from the 493 total.
What counts as a good injury rate for a warehouse?
There is no universal good number. Start with your own rate against the published rate for your own industry code, for the same year, using the same case definition.
The formula is BLS's, and it is simple:
Rate = (number of cases × 200,000) ÷ hours worked by all employees
The 200,000 is 100 workers × 40 hours × 50 weeks. It is what turns a raw count into something comparable between a 40-person cross-dock and a 4,000-person fulfillment center.
Worked example. A warehouse logs 7 recordable cases and its people work 420,000 hours in the year.
7 × 200,000 ÷ 420,000 = 3.33 cases per 100 full-time-equivalent workers
Against the 2024 warehousing rate of 4.8, that is 69% of the industry figure. Against the 2.3 private-industry average, it is 145%. Both readings are true. Neither is a finding that the facility is safe or unsafe.
Use the calculator below to run your own numbers against the 2022–2024 benchmark tables. Choose the year, warehouse type and case category, then enter your matching case count and hours worked. It returns your rate, the matching published benchmark, the 2024 uncertainty range where available, and a citation you can copy. A missing benchmark stays missing.
<iframe src="data/warehouse-injury-calculator.html" title="Warehouse injury rate calculator and benchmark lookup" width="100%" height="1120" loading="lazy"></iframe>Open the warehouse injury rate calculator in its own page
One boundary: this is a comparison tool. It is not an OSHA log, not a compliance determination, and not a judgement about whether a particular building is safe.
How many warehouse workers die on the job?
Thirty-two workers in U.S. private-industry warehousing and storage died from work injuries in 2024, up from 28 in 2023. In the same year, the national fatal occupational injury count fell 4.0%.
Fatality data comes from a different BLS program — the Census of Fatal Occupational Injuries (CFOI), which uses multiple records to identify fatal occupational injuries rather than estimating them from a sample. It is not a count of every death from work-related disease. Its coverage differs from the nonfatal survey, so we do not add the two programs' totals together. CFOI coverage
U.S. fatal occupational injuries, 2023 and 2024
The national row includes all CFOI ownership categories; the industry rows below are private industry. Shares use the national total as their denominator.
Scroll horizontally to view all columns.
| Population | 2023 | 2024 | Change | Share of U.S. total, 2024 |
|---|---|---|---|---|
| All U.S. fatal occupational injuries | 5,283 | 5,070 | −4.0% | 100% |
| Construction (for scale) | 1,075 | 1,034 | −3.8% | 20.4% |
| Transportation and warehousing sector | 930 | 865 | −7.0% | 17.1% |
| Warehousing and storage (NAICS 493) | 28 | 32 | +14.3% | 0.6% |
Sources: BLS CFOI news release, February 19, 2026 for national totals; The Economics Daily, April 2026 for sector and construction; Industry at a Glance: NAICS 493 for the warehousing rows. Shares and changes calculated by us. Read 2026-09-17.
Be careful with that +14.3%. It is four deaths on a base of 28. At that scale, a single bad month moves the percentage. One year is not a trend, and BLS's move to the 2022 NAICS structure broke the warehousing series at 2023, so a longer series needs its classifications reconciled before those years are joined. BLS notes the break.
Fatal occupational injuries by event, U.S. private-industry warehousing and storage, NAICS 493, 2023–2024
Scroll horizontally to view all columns.
| Event or exposure | 2023 | 2024 |
|---|---|---|
| Total | 28 | 32 |
| Violent acts | 7 | 10 |
| Transportation incidents | 10 | 7 |
| Contact incidents (struck by, caught in, crushed) | 3 | 6 |
| Exposure to harmful substances or environments | 4 | 5 |
| Falls, slips, trips | 4 | not published |
| Explosions and fires | not published | not published |
Source: BLS CFOI Table A-1, 2023 and 2024, private industry, warehousing and storage row. Suppressed cells are unknown, not zero; do not calculate them by subtracting the published events from the total. Read 2026-09-17.
Nationally in 2024, transportation incidents had the largest fatal occupational injury count at 1,937, followed by falls, slips and trips at 844, contact incidents at 756, and violent acts at 733. BLS CFOI national event totals
What actually hurts warehouse workers
Material handling is a major source of warehouse injury concerns. OSHA identifies musculoskeletal disorders, especially overexertion from lifting and lowering, and injuries involving powered industrial trucks or other material-handling equipment. OSHA warehouse safety overview
Across all private industry over 2023 and 2024 combined, the largest event group of DART cases came from overexertion, repetitive motion and bodily conditions — 946,290 DART cases — followed by contact incidents at 860,050. BLS combined-period release
Two cautions on those figures, because they are widely misused.
They are two-year totals, not annual ones. BLS now publishes case-characteristic detail on a two-year cycle. They do not describe a single year.
They describe all private industry, not warehouses. They are not a numerical breakdown of warehouse injuries. For that separate detail, use the industry-specific case-characteristics tables in BLS's nonfatal data index, matching the period and case population. A sprain is a nature of injury; overexertion is an event; a back injury names a body part. Those classifications answer different questions.
What we can say about warehouse hazards specifically comes from OSHA, qualitatively. Its warehousing safety topic page and its warehouse inspection program point at the same set: powered industrial trucks, material handling and storage, walking and working surfaces, means of egress, and fire protection, with ergonomics and heat as ongoing concerns.
Forklift-involved incidents are a different population; our forklift accident statistics reference covers that equipment-based question separately.
And one thing this page deliberately does not do: estimate what share of warehouse injuries happen at the loading dock. The published data does not support that figure. See what these numbers can't tell you.
Is OSHA targeting warehouses?
Yes. OSHA runs a National Emphasis Program on Warehousing and Distribution Center Operations — directive CPL 03-00-026 — which tells inspectors to go looking at these facilities rather than waiting for a complaint.
An emphasis program is not a new rule. It creates no new duty for an employer. It is an inspection targeting instruction that enforces standards already on the books.
The program began on July 13, 2023 with a three-year term. OSHA's current directive entry is dated July 31, 2026. Its August 6, 2026 announcement says the program was renewed and expanded from three to five years. Current directive entry · OSHA renewal announcement
How related U.S. industry codes differ, checked September 17, 2026
This is an industry-definition comparison, not an exact targeting list from the OSHA directive. A code appearing in a state statute does not remove its employee-size and other coverage conditions.
Scroll horizontally to view all columns.
| NAICS | Industry | In BLS's warehouse statistics? | In Minnesota's warehouse statute? |
|---|---|---|---|
| 491110 | Postal service | No | No |
| 492110 | Couriers and express delivery services | No | Yes |
| 492210 | Local messengers and local delivery | No | No |
| 493110 | General warehousing and storage | Yes | Yes |
| 493120 | Refrigerated warehousing and storage | Yes | No |
| 493130 | Farm product warehousing and storage | Yes | No |
| 493190 | Other warehousing and storage | Yes | No |
Sources: BLS industry definitions and 2024 SOII industry table; Minn. Stat. 182.6526, subd. 1(g). Crosswalk compiled by us, 2026-09-17.
Where the injury rate becomes a legal trigger
In Minnesota, an injury rate can trigger an investigation and monthly safety committee meetings. California also has an injury-rate referral provision, but it works differently.
Under Minn. Stat. 182.6526, subd. 5, a covered work site or employer with an incidence rate at least 30% higher than that year's average for its relevant NAICS code triggers a required state investigation. It must also hold the safety committee meetings described in section 182.676 monthly until it remains below that trigger for two consecutive years. The comparison must match the year and industry code.
Minnesota agency's posted national industry benchmarks, 2021–2023, and 2023-based 30%-above line
All rates are injury and illness cases per 100 FTE. This reproduces the agency's posted table; it is not a calculation of a currently applicable legal threshold.
Scroll horizontally to view all columns.
| NAICS | Industry | Rate 2021 | 2022 | 2023 | Published 30%-above line | Our recomputation |
|---|---|---|---|---|---|---|
| 493110 | General warehousing and storage | 5.6 | 5.7 | 4.8 | 6.24 | 6.24 ✓ |
| 423 | Merchant wholesalers, durable goods | 2.1 | 2.3 | 2.6 | 3.38 | 3.38 ✓ |
| 424 | Merchant wholesalers, nondurable goods | 3.5 | 3.6 | 3.1 | 4.03 | 4.03 ✓ |
| 454110 | Electronic shopping and mail-order houses | 1.4 | 1.4 | 1.3 | 1.69 | 1.69 ✓ |
| 492110 | Couriers and express delivery services | 8.0 | 9.8 | 9.7 | 12.61 | 12.61 ✓ |
Source: Minnesota Department of Labor and Industry, MNOSHA Compliance: Warehouse workers, read 2026-09-17. Rates are per 100 full-time-equivalent workers and are attributed there to BLS. The recomputation column is ours: published rate × 1.3. All five match.
Two observations, both simply what we saw on the page on our verification date.
The newest column in Minnesota's table is calendar year 2023, and the page records that it was last updated September 4, 2025. BLS published the 2024 figures on January 22, 2026. The statute uses the average for the year being compared. Do not use the posted 2023 line for another year without checking the applicable benchmark. The same page's text describes the data as calendar year 2021 while its table runs to 2023.
These four state examples cover different combinations of quotas, injury-reduction programs and rate-based enforcement. This is not a complete inventory of state warehouse laws.
Scroll horizontally to view all columns.
| State | Instrument | Effective | Who is covered | Core requirement | Tied to a published injury rate? |
|---|---|---|---|---|---|
| California | Labor Code 2100–2112 (AB 701) | Jan 1, 2022 | 100+ at one center, or 1,000+ statewide, subject to the statute's coverage definitions | Written quota disclosure; quotas may not block breaks or safety compliance | Yes: interagency referral under 2107(b) |
| Washington | RCW 49.84 (HB 1762) | Jul 1, 2024 | 100+ at one center, or 1,000+ statewide, under RCW 49.84.010(9) | Quota disclosure; limits protecting breaks and safety compliance | No comparable injury-rate trigger identified in these provisions |
| Minnesota | Minn. Stat. 182.6526 with 182.676 | Current codified text checked Sept 17, 2026 | 250+ at one center, or 1,000+ statewide; defined employees and business aggregation rules apply | Quota and work-speed disclosure; investigation and monthly committee meetings at the rate trigger | Yes: subd. 5 |
| New York | Labor Law 780 and 789 | Injury-reduction program effective Jun 1, 2025 | 100+ at one center, or 1,000+ statewide; statutory employee and quota definitions apply | Written injury-reduction program for musculoskeletal disorders; ergonomic assessment; training | No comparable rate trigger in section 789 |
Sources: California chaptered AB 701 text, sections 2100 and 2107 and Labor Commissioner guidance; Washington RCW 49.84.010 and Labor & Industries guidance; Minn. Stat. 182.6526; New York Labor Law 780, 789 and Department of Labor guidance. Compiled 2026-09-17. These are coverage summaries, not a facility-specific legal determination.
California's section 2107(b) uses the wording “at least 1.5 times higher than” the industry's annual average injury rate. It directs the Division of Occupational Safety and Health or the Division of Workers’ Compensation to notify the Labor Commissioner, who determines whether an investigation of violations is appropriate. That is a referral rule, not Minnesota's monthly-meeting rule; this calculator does not turn that statutory wording into a California compliance threshold.
For Washington's headcount boundary, the table follows the enacted statute's 100 or more / 1,000 or more wording. The agency overview says “more than” those counts; the statute is the source used here. New York's employee definition covers nonexempt employees subject to a quota and excludes drivers and couriers traveling to and from a center. Those details matter at the coverage boundary.
What warehouse injury statistics looked like in 1950
BLS published a detailed study of warehouse injuries in January 1955: BLS Bulletin No. 1174, Injuries and Accident Causes in Warehousing Operations, by Frank S. McElroy and George R. McCormack of the Bureau's Branch of Industrial Hazards. The tables below recover selected figures from that study. Original bulletin
It is a serious piece of work. 2,695 public warehouses reported — about 28% of the public-warehouse establishments the bulletin described — covering 31,956 inside warehouse employees. Of those, 274 opened their original accident records to a BLS representative, producing 1,604 individually coded disabling injuries. That detailed follow-up excluded establishments that had reported no disabling injuries; it was not a representative cross-section of every warehouse.
Its boundary was different from the modern industry classification. The study covered public warehouses, storage for hire, and expressly excluded storage owned and operated by manufacturers or retailers for their own products. That historical exclusion cannot be carried over to today's establishment-based NAICS data.
The industry rate then. In 1952, the latest final year in the bulletin, warehousing and storage ran 36.4 disabling injuries per million employee-hours. More than double the all-manufacturing average. Among the 49 non-manufacturing industry groups BLS then published, only six ran higher — five construction activities and stevedoring. In seven of the eight postwar years the rate sat above 30; the one exception was 1948, at 26.6.
By warehouse type, U.S. public-warehouse study, 1950 (source-reported disabling injuries per million employee-hours; calculated column restates the same historical measure per 200,000 hours)
Scroll horizontally to view all columns.
| Warehouse type | 1950 frequency rate | Calculated per 200,000 hours |
|---|---|---|
| Refrigerated, food products | 40.9 | 8.18 |
| Refrigerated, all | 39.7 | 7.94 |
| Canned goods | 39.5 | 7.90 |
| Merchandise | 33.0 | 6.60 |
| Cotton | 26.7 | 5.34 |
| Farm products | 25.0 | 5.00 |
| Grain elevators | 22.1 | 4.42 |
| Household goods | 21.0 | 4.20 |
Source-reported rates: BLS Bulletin No. 1174, January 1955, Table 1, printed p. 41. Population: reporting U.S. public warehouses, 1950. Calculated column = original frequency × 0.2; historical disabling injuries, not modern SOII cases. Verified 2026-09-17.
By occupation, U.S. public-warehouse study, 1950 (selected; disabling injuries per million employee-hours, with a calculated conversion per 200,000 hours)
Scroll horizontally to view all columns.
| Occupation | 1950 frequency rate | Calculated per 200,000 hours |
|---|---|---|
| Coolermen | 85.9 | 17.18 |
| Ice handlers | 76.1 | 15.22 |
| Freezermen | 61.7 | 12.34 |
| Handlers and stackers | 51.6 | 10.32 |
| Handtruckers | 44.0 | 8.80 |
| General warehousemen | 38.2 | 7.64 |
| Maintenance workers | 37.2 | 7.44 |
| Packers and craters | 35.6 | 7.12 |
| Order fillers | 34.6 | 6.92 |
| Elevator operators | 27.0 | 5.40 |
| Forklift operators | 26.2 | 5.24 |
| Refrigerating engineers | 18.9 | 3.78 |
| Janitors | 11.4 | 2.28 |
| Watchmen | 9.8 | 1.96 |
Source-reported rates: BLS Bulletin No. 1174, January 1955, Table 1, printed p. 41. Selected occupations in reporting U.S. public warehouses, 1950. Calculated column = original frequency × 0.2. Verified against the table image 2026-09-17.
By metropolitan area, U.S. public-warehouse study, 1950 (disabling injuries per million employee-hours, with a calculated conversion per 200,000 hours)
Scroll horizontally to view all columns.
| Metro area | 1950 frequency rate | Calculated per 200,000 hours |
|---|---|---|
| San Antonio | 66.2 | 13.24 |
| Kansas City | 50.6 | 10.12 |
| Minneapolis–St. Paul | 50.5 | 10.10 |
| New Orleans | 40.4 | 8.08 |
| New York–Northeastern New Jersey | Not used: source-text conflict | — |
| Philadelphia | 32.5 | 6.50 |
| Buffalo | 29.3 | 5.86 |
| Los Angeles | 25.6 | 5.12 |
| Boston | 25.5 | 5.10 |
| Chicago | 23.8 | 4.76 |
Source-reported rates: BLS Bulletin No. 1174, January 1955, metropolitan-area discussion and Table 3, printed p. 43. Population: reporting public warehouses in the named U.S. areas, 1950. Calculated column = original frequency × 0.2. The New York–Northeastern New Jersey value is withheld because the accessible text versions of the narrative and appendix disagree. Missing here is not zero. Verified 2026-09-17.
What they were writing about in 1955
The causes section still sounds familiar. Four accident types accounted for more than four-fifths of the study's classified disabling injuries: workers struck by moving objects (30.7%), overexertion (23.4%), caught in or between moving objects (about one in six), and falls (about 12%). Containers were the recorded agency of injury in 30.3% of those cases; nearly half of the container cases were strains from lifting. These are figures from the detailed historical study, not estimates for all U.S. warehouse injuries today.
And in a passage on inadequate guarding, the bulletin names the lack of any way to anchor dock plates, which it says frequently let the plates shift and drop workers and their loads into the space between the dock and the vehicle. It also flags loading docks made slippery by rain, snow and sleet, and dock plates worn smooth with use. Bulletin, accident types and agencies of injury, printed pp. 18–25
The reversal
In the 1950 study, refrigerated warehouses had the highest disabling-injury frequency among the broad warehouse types, and the three highest-rate occupations listed — coolermen, ice handlers, freezermen — were all cold-storage jobs.
In 2024, refrigerated warehousing runs 3.4 nonfatal injury and illness cases per 100 FTE against 4.9 for general warehousing, in U.S. private industry. The two approximate intervals shown above do not overlap. The ordering differs between the two studies, but the populations and injury measures differ too. This is not evidence of how much mechanical handling, palletization or any other change reduced risk.
So how much safer is warehouse work?
These two studies do not establish a percentage improvement. We can put the exposure units on the same scale; we cannot make their injury definitions and populations identical.
The 1952 rate of 36.4 per million employee-hours converts to 7.28 disabling injuries per 200,000 employee-hours:
36.4 × 200,000 ÷ 1,000,000 = 7.28
Why the historical rate is not a modern days-away or DART rate — U.S. source definitions
Scroll horizontally to view all columns.
| Measure | What is counted | Population and period | Rate per 200,000 employee-hours |
|---|---|---|---|
| Historical disabling injuries | Fatal injuries, permanent impairments, and qualifying temporary disabilities under the American Standards Association method approved in 1945 | Historical warehousing industry measure, 1952; the bulletin's detailed 1950 study covered public warehouses | 7.28, calculated from 36.4 per million hours |
| Modern days-away cases | Nonfatal injury and illness cases with days away beyond the day of onset; some also involve restricted work | U.S. private-industry warehousing and storage, NAICS 493, 2024 | 1.5, source-reported |
| Modern DART cases | Modern days-away cases plus restriction/transfer-only cases | U.S. private-industry warehousing and storage, NAICS 493, 2024 | 4.1, source-reported |
Sources: BLS Bulletin No. 1174, printed pp. 1–5; BLS SOII case definitions; 2024 SOII Table 1, NAICS 493. A modern rate per 100 FTE uses 200,000 hours. The historical conversion is Uptime's arithmetic, not an agency finding of a change in safety. Verified 2026-09-17.
A temporary disability in the old method could qualify when a worker could not do regularly established work through an available full shift. That is not identical to the modern split between days away and restricted work. The old method also included fatal and permanent-impairment cases. Collection methods and establishment coverage differ as well.
A percentage calculated across those rows would be precise arithmetic applied to unlike measures, not a defensible estimate of how much safer warehouse work has become.
Five warehouse claims that don't hold up
These are five ways to misread the data. The correction is usually to keep the measurement, population and year attached.
Scroll horizontally to view all columns.
| The claim or shortcut | Why it does not follow | What the verified figures say |
|---|---|---|
| Treating transportation-and-warehousing cases as warehouse cases | The sector includes transportation industries outside NAICS 493 | U.S. private industry, 2024: 77,000 nonfatal injury and illness cases in warehousing and storage; 261,500 across the sector |
| Treating a share of deaths as a worker's fatality risk | A share of a count has no hours-worked or employment denominator | Private-industry NAICS 493 had 32 fatal occupational injuries in 2024, 0.6% of the 5,070 national total; that is not a fatality rate |
| Multiplying reported injuries by a fixed near-miss ratio | These BLS injury tables do not measure near misses | They provide no warehouse-specific multiplier for estimating near misses |
| Calling a warehouse-industry total a loading-dock accident total | Industry classification does not identify the physical place or equipment involved in every case | The 77,000 estimate is for the whole NAICS 493 industry, not its loading docks |
| Quoting a warehouse rate without a year or case definition | Rates vary by period and by what is counted | The U.S. private-industry NAICS 493 total-recordable injury and illness rate was 4.8 per 100 FTE in 2024 |
Sources: BLS SOII 2024 rates, 2024 counts and survey concepts; 2024 CFOI industry table. Uptime's interpretation checklist, verified 2026-09-17; not a reconstruction of unattributed online claims.
A real number from a real source can still answer the wrong question. That is why every figure on this page needs its population and its date.
What these numbers can't tell you
Worth reading before you quote anything above.
An industry code is not a building census. Industry statistics are classified by the establishment's activity, not simply the parent company or the room where an injury happened. A retailer-owned warehouse can be classified in NAICS 493. An office employee at a warehousing establishment can also be in that establishment's industry total. BLS establishment classification
Cases are not people. One worker can generate more than one recordable case in a year. The counts are cases.
The rate is not a percentage of workers. It is cases per 100 full-time-equivalent workers, built from hours worked.
"All private industry" includes warehousing. The comparison benchmark is not a warehouse-free baseline.
Case types are nested. DART contains both days-away and restricted-duty cases. Adding DART to its own components double-counts.
Missing is not zero. Suppressed and unpublished cells — farm product warehousing in 2024, several fatal event cells — are unknown. We never fill them by subtraction.
Fatal and nonfatal data come from different programs with different coverage. CFOI identifies fatal occupational injuries from multiple records; SOII estimates nonfatal injuries and illnesses from a sample. We do not add their totals. CFOI concepts
The survey has known gaps. SOII excludes the self-employed, farms with fewer than 11 employees, private households and federal government workers. It collects state and local government data separately from the private-industry figures used here. It relies on employer records, so recordkeeping limitations are not captured by a sampling-error range. BLS SOII coverage and concepts
Sampling error is real and we have only partly shown it. We publish relative standard errors for 2024 and calculated ranges for the warehouse types. We did not apply them to every figure on the page.
Series breaks block long trend lines. A revised injury classification system broke the case-characteristic series at 2023–2024, and the move to the 2022 NAICS structure broke the warehousing fatality series at 2023.
Small numbers move for small reasons. Thirty-two deaths is a small count. Read single-year changes accordingly.
No dock-share figure exists here. We do not publish an estimate of what share of warehouse injuries happen at the loading dock, on a dock leveler, or around a dock door. The industry tables used here do not isolate those locations or equipment categories.
If what you actually need is help telling one piece of dock equipment from another, that is a different question and a different page: dock leveler types and common failures.
Methodology
What we did. We compiled the figures on this page from published BLS tables and one 1955 BLS bulletin, compared their scope with BLS definitions, OSHA's published inspection scope and four state statutes, and calculated the shares, ratios, ranges and unit conversions shown. The published inputs and calculations were checked on September 17, 2026.
Sources and editions.
- Nonfatal counts, rates and relative standard errors: BLS Survey of Occupational Injuries and Illnesses, annual tables for data years 2022, 2023 and 2024. The 2024 estimates were released January 22, 2026 as USDL-26-0101. The annual tables' footnotes label their industry structure as 2017 NAICS; the downloads retain that source-specific label.
- Sector-level 2024 figures: the BLS chart tables published with that release.
- Fatal injuries: BLS Census of Fatal Occupational Injuries, Table A-1 for 2023 and 2024. The 2024 data was released February 19, 2026 as USDL-26-0230.
- Historical: BLS Bulletin No. 1174, January 1955, covering 1950 detail and selected 1948 and 1952 industry rates.
How rows were joined. Counts and rates for the same year, industry code and case type were matched from the rate table and the count table, then matched again to the 2024 rate RSE table and count RSE table. Table A-1 supports rate RSEs; Table A-2 supports count RSEs. No row is combined across data years. The NAICS 493 aggregate contains its own subsectors, and the private-industry benchmark contains warehousing; neither is a sum of independent groups.
How derived figures were computed. Every calculation on this page carries its formula in the text or in the downloadable calculations file, and all of them were run with a script rather than by hand:
- Ratios between industries use BLS's published rounded rates.
- Shares use published case counts, so both sides of a comparison sit on the same basis.
- Approximate 95% ranges: estimate ± 1.96 × estimate × (RSE ÷ 100). These are ours, not BLS output, and they describe sampling uncertainty only.
- The 1950s conversion multiplies a frequency rate per million employee-hours by 0.2 to restate it per 200,000 hours. It changes units, not case definitions.
Evidence marks. ★ Source-reported means the figure is printed in the cited source. ● Calculated means we computed it from source-reported inputs. Both are verified; neither means pending.
Missing values and historical extraction. Blank numeric CSV cells and JSON null mean unknown or not applicable, not zero. The status fields distinguish an unpublished source value from an RSE not collected for this compilation. Historical occupation rates were checked against the scanned Table 1. The New York–Northeastern New Jersey historical cell is retained without a number because the available narrative and appendix text conflict; it is excluded from calculations.
Terms used here. Recordable case: a work-related injury or illness an employer must log under OSHA recordkeeping rules. DAFW: cases with days away from work. DJTR: cases with days of job transfer or restriction only. DART: DAFW plus DJTR. Other recordable case: a recordable case with neither. FTE: full-time equivalent, 2,000 hours worked. RSE: relative standard error, the sampling error of an estimate expressed as a percentage of it. NAICS: the industry classification system used to sort establishments. SOII and CFOI: the BLS nonfatal survey and the fatal injury census.
Sources
Nonfatal injuries and illnesses — BLS Survey of Occupational Injuries and Illnesses
-
Table 1. Injury and illness rates by industry, 2024, national — accessed 2026-09-17
-
Table 2. Injury and illness counts by industry, 2024, national — accessed 2026-09-17
-
Table A-1. Relative standard errors for industry rates, 2024, national — accessed 2026-09-17
-
Table 1 and Table 2 for 2023; Table 1 and Table 2 for 2022 — accessed 2026-09-17
-
Employer-Reported Workplace Injuries and Illnesses, 2023–2024, USDL-26-0101, January 22, 2026 — accessed 2026-09-17
-
Charts for the 2024 release: number and rate by industry — accessed 2026-09-17
-
Handbook of Methods: SOII calculation — accessed 2026-09-17
-
Table A-2, relative standard errors for industry counts, 2024 — verified 2026-09-17
-
Handbook of Methods: SOII concepts and coverage and OSHA 1904.7 recordability criteria — verified 2026-09-17
Fatal injuries — BLS Census of Fatal Occupational Injuries
-
National Census of Fatal Occupational Injuries in 2024, USDL-26-0230, February 19, 2026 — accessed 2026-09-17
-
Table A-1. Fatal occupational injuries by industry and event or exposure, 2024 and 2023 — accessed 2026-09-17
-
The Economics Daily: Fatal work injuries declined in 2024 — accessed 2026-09-17
-
Handbook of Methods: CFOI concepts and coverage — verified 2026-09-17
Industry definition and historical
-
BLS Industry at a Glance: Warehousing and Storage, NAICS 493 — accessed 2026-09-17
-
Frank S. McElroy and George R. McCormack, Injuries and Accident Causes in Warehousing Operations, BLS Bulletin No. 1174, January 1955 — accessed 2026-09-17
-
BLS: Measuring industry employment—a look at the auxiliary-unit concept — verified 2026-09-17
Enforcement and state rules
-
OSHA directive CPL 03-00-026, National Emphasis Program on Warehousing and Distribution Center Operations — accessed 2026-09-17
-
OSHA warehousing safety topic page — accessed 2026-09-17
-
Minnesota DLI, MNOSHA Compliance: Warehouse workers, and Minn. Stat. 182.6526 with 182.676 — accessed 2026-09-17
-
New York Labor Law 780 (definitions), 789 (injury-reduction program) and Department of Labor program guidance — verified 2026-09-17
-
California AB 701 chaptered text and Labor Commissioner guidance; Washington RCW 49.84.010 and Labor & Industries guidance — verified 2026-09-17
-
OSHA renewal announcement, August 6, 2026 and warehousing enforcement scope — verified 2026-09-17
Our editorial policy describes how corrections and substantive updates are handled.
How to cite this page
Suggested citation for the compiled dataset:
Uptime Dock & Door Research. Warehouse Injury Statistics Dataset, version 1.0.1. Compiled from U.S. Bureau of Labor Statistics SOII and CFOI tables, BLS Bulletin No. 1174, and the named federal and state sources. Verified September 17, 2026. uptimedockanddoor.com/research/warehouse-injury-statistics/
If you are quoting a single figure, cite BLS and the data year as well — for example: BLS Survey of Occupational Injuries and Illnesses, 2024, NAICS 493; compiled by Uptime Dock & Door Research. The measurement belongs to BLS. The assembly, the crosswalk and the calculations are ours.
Download the data
Free, no sign-up, no email. The data rows carry source URLs, source locators and verification dates; the dictionary explains the fields.
Scroll horizontally to view all columns.
| File | Rows | What's in it |
|---|---|---|
| warehouse-injury-benchmarks-2022-2024.csv | 90 | Counts, rates, 2024 RSEs and calculated rate intervals; 84 published observations plus six explicitly missing records |
| warehouse-fatal-injuries-2023-2024.csv | 20 | Fatal injuries in warehousing by event, plus national, sector and construction totals |
| warehouse-definition-crosswalk.csv | 26 | Source-grounded BLS/state industry definitions and OSHA's agency-described scope; not an exact OSHA targeting appendix |
| warehouse-minnesota-trigger.csv | 5 | Posted 2021–2023 benchmark table and 2023-based threshold recomputation; not a current legal determination |
| warehouse-injury-1950-bulletin-1174.csv | 39 | Selected 1948–1952 historical rates, including 38 verified numeric records and one withheld historical cell; conversions retain the old injury definition |
| warehouse-injury-calculations.csv | 30 | Shares, ratios, changes, selected intervals and worked examples with source inputs and formulas; remaining row-level conversions and intervals are in their source tables |
| warehouse-industry-comparison-2024.csv | 8 | The eight 2024 industry-comparison rows with matched counts and rates |
| warehouse-injury-context-figures.csv | 13 | National event figures and historical study context used in the text |
| warehouse-injury-data-dictionary.csv | 146 | A definition, data type and missing-value rule for every field in the eight data tables |
| warehouse-injury-dataset.json | all | All nine tables, source register and handling rules |
| warehouse-injury-benchmarks-2022-2024.json | 90 | The same benchmark records in standalone JSON |
| warehouse-injury-chart-inputs.json | 6 | The source-linked annual rate values for the trend chart |
BLS states that its published material is in the public domain, except previously copyrighted photographs and illustrations. BLS reuse information. That does not assign a new license to every part of this compilation or to third-party source material. Please retain source attribution and the measurement definitions when citing the data.
Common questions
Is warehousing one of the most dangerous industries in America? Its 2024 total-recordable nonfatal injury and illness rate of 4.8 per 100 FTE was roughly twice the U.S. private-industry average. Its 32 fatal occupational injuries were 0.6% of the national count, but that does not establish a below-average fatality risk. Comparing fatality risk requires a matching exposure denominator, not just death counts. BLS nonfatal rates · CFOI scope and rates
Why was the warehouse injury rate lower in 2024 than in 2022? The published data shows the rate fell from 5.5 in 2022 to 4.8 in 2024. It does not say why. Anyone attributing that to automation, training or staffing is adding an explanation the survey does not contain.
Does this include Amazon? Establishments are classified by what they do. The company name alone does not tell you which establishments appear in NAICS 493. A retailer-owned fulfillment or storage establishment can be classified in warehousing; another establishment can have a different industry code. We have not published company-level figures. BLS establishment classification
Where do I find my own facility's NAICS code? Confirm the code for the specific establishment rather than assuming a parent-company tax code applies. The Census NAICS search lets you compare industry descriptions; OSHA's code-finding guidance also points to the Census definitions and agency assistance. Use the matching code and source edition, not automatically the 493 headline, when you benchmark.
Are warehouse injury rates published by state? BLS publishes state-level injury data for participating states, and several state agencies publish their own industry tables. We have not compiled a state-by-state warehouse layer for this page, so we are not going to imply one exists here.
Why is the newest data from 2024 when it is 2026? The survey year and the release date are different things. BLS published the 2024 nonfatal estimates in January 2026 and the 2024 fatality data in February 2026. A "2024" figure describes the 2024 data year. A later verification date does not turn it into a count of 2026 injuries.
Uptime Dock & Door Research is the independent research and reference section of uptimedockanddoor.com. Uptime Dock & Door is an independent commercial service-referral publisher for loading docks and commercial doors. It is not a repair contractor, manufacturer, laboratory, standards body or government agency, and has no affiliation with the Bureau of Labor Statistics or OSHA. More about who we are and how we work: About · Editorial policy.
Warehouse injury rate calculator (interactive tool)
Tool not loading, or prefer it full-page? Open the standalone warehouse injury rate calculator directly.
The research library is maintained separately from Uptime's service-request pages. See the About Uptime Dock & Door, editorial policy and contact information.